Light Bio · Season 3 Revenue Dashboard

Firefly Petunia · D2C performance overview · all figures on a Gross revenue basis
Data range Orders Units Export window Generated
01

Revenue overview

Gross → Discounts → Returns → Net → +Tax → Total

Revenue waterfall: how gross becomes total sales

Financial summary

Figures match Shopify's order-level financial report. Net sales = Gross − Discounts − Returns. Total sales = Net + Taxes.
02

Revenue trend

Weekly & monthly · gross with net overlay

Monthly breakdown

03

Where revenue came from

By Shopify sales channel

Gross by channel

Share of gross

04

Products

Rolled up to parent SKU · click a row for variants

Gross by parent SKU

Product revenue is line-item Gross (the financial export has no SKU). It reconciles to the order-level gross within 0.03%. Discounts and taxes are applied at the order level and are not allocated to individual SKUs.
05

Geography & demand

Shipping destination · state, then city

By state

Top cities

06

Discount codes

Promotional vs service / replacement credits

Discount value by code (top 14)

All codes

Of the $44.0K in coded discounts, about 90% ($39.4K) is service / replacement credit (dead or delayed-plant replacements, courtesy adjustments), not marketing. True promo codes total only about $4.6K. The revenue summary shows $68.1K total discounts: the additional $24.2K is order-level manual discounts with no code attached.
07

Order ledger

08

Shipping & fulfillment

From export files · 13,817 labels · US · Mar 16 to Jun 22

Fulfillment funnel · order status

13,817 labels across 11,598 shipped orders, about 1.2 boxes per order. Customers pay nothing for shipping, so this spend is the brand's absorbed cost.

Service mix · share of labels

Plant vs non-plant · cost per label

Dispatch day · when labels were created

Busiest single day was May 5 with 1,520 labels. Ship days are Monday, Tuesday, Wednesday with a Tuesday cutoff.
09

Speed, cost & delays

Scheduled transit · promised window vs ship date
Speed and lateness here are scheduled or estimated. The files hold a promised delivery window and a ship date but no carrier delivery confirmation, so these figures use the promise plus standard transit times, not measured deliveries.

Cost and delays by state · top 12 by volume. Service and speed are uniform by design, so cost and the estimated late rate are the real geographic stories

StateLabelsAvg costTop serviceTransitEst. late

Weekly volume and average cost

Shipping week · USDA schedule SW 12 to 21

Weight tiers · volume and average cost

Cost by shipping zone · distance from warehouse

10

Consumer awareness (Goal 1)

Unique engaged US visitors · GA4 425544126 · Jan 1 to Jun 30, 2026
Season US active users
935,914
Unique US users, Jan 1 to Jun 30. Total Users 936,873 within rounding.
Largest month · June
517,453
Through Jun 28
Largest week
485,385
Single highest week, early June

US active users against the bonus goal tiers (0 to 3,000,000)

935,914
0 Goal 1 · 1.0M Goal 2 · 2.0M 3.0M
Season total of 935,914 US active users, shown against the goal tiers of 1,000,000, 2,000,000, and 3,000,000. The total falls below the Goal 1 tier of 1,000,000.

US active users by month

550K275K0 4,610 11,902 55,346 45,323 305,572 517,453 JanFeb MarApr MayJun
The May and June rise coincides with the Facebook and YouTube awareness flights launched May 29. June was the largest month at 517,453, recorded through June 28.

Active users by source · Season

Google Ads
387,438
Facebook
226,243
Google organic
86,966
Direct
49,095
Email + other
~46,000
Google Ads and Facebook were the two largest sources of Season audience. By session source and medium across all geographies; the US share is the large majority.

Engaged sessions (US)

The Season recorded 222,058 engaged sessions in the US, summed across the six months. This matches the GA4 season figure of 221,271 within rounding.
Jan 3,181Feb 9,054Mar 31,175Apr 31,694May 102,486Jun 44,468
May had the largest monthly block of engaged sessions at 102,486. June engaged sessions were 44,468 against 517,453 active users for the month.

How this maps to the bonus

BasisActive Users, US only, GA4
Season windowJan 1 to Jun 30, 2026
Season total935,914
Goal 1 tier1,000,000
Tier reachedBelow Goal 1
The engaged-visit basis (50% scroll, 10 seconds, or 2+ pageviews) is lower than active users. Both the active-users and engaged-visit readings fall below the 1,000,000 Goal 1 tier. June covers Jan 1 to Jun 28; Jun 29 and 30 are not yet in GA4.
11

D2C ROAS performance (Goal 2)

Blended D2C ROAS · sales campaigns · platform-reported · Jan 1 to Jun 30, 2026
Season blended D2C ROAS
3.19x
Sales campaigns only, using each platform's own reported sales across Google, Meta, and Amazon. The GA4 de-duplicated basis, which removes cross-channel overlap, reads lower at 1.89x.
Sales ad spend
$163,518
Google $93,949, Meta $67,944, Amazon $1,624. Awareness excluded.
Platform-reported sales
$521,675
Google $378,708, Meta $136,306, Amazon $6,661.

Blended ROAS against the bonus goal tiers (0 to 5.00x)

3.19x
1.89x GA4
0 Goal 1 · 4.00x Goal 2 · 4.50x 5.00x
The solid bar is the blended ROAS of 3.19x on the platform-reported basis you selected. The thin coral line marks the GA4 de-duplicated reading of 1.89x, which removes the overlap between channels. Both fall below the Goal 1 tier of 4.00x, so no ROAS tier is reached for the Season.

Blended ROAS by month · platform basis, Google plus Meta

6.0x3.0x0 Goal 1 · 4.0x 5.35x 4.55x 3.41x 2.45x 3.39x FebMar AprMay Jun
On the platform basis, February and March cleared the 4.0x goal line, then ROAS slid through the April to May scale-up as average order value softened. January carried no spend. Amazon began only in mid-May and is held out of this monthly view; it is folded into the Season blended figure.

Channel ROAS · platform basis, against the 4.0x goal

Google Ads
4.03x
Amazon (SP)
4.10x
Meta
2.01x
Blended
3.19x
Amazon 155 ordersSP brand-exact 5.26xSP 1-plant 5.02x
The dashed coral pin is the 4.00x goal. Google and Amazon Sponsored Products both edged past 4.0x on the platform basis, with Amazon's small but efficient brand-exact and 1-plant campaigns leading. Meta sat at 2.01x and is what pulls the blend below target.

Spend and sales reconciliation · sales campaigns, platform-reported

ChannelSales spendPlatform salesROAS
Google Ads$93,949$378,7084.03x
Meta$67,944$136,3062.01x
Amazon (Sponsored Products)$1,624$6,6614.10x
Blended$163,518$521,6753.19x
Spend is platform billing media spend on sales campaigns only. Sales are each platform's own reported conversion value: Google Conv. value, Meta Purchase conversion value, and Amazon advertised-product Sales. Awareness campaigns are excluded, including the Meta traffic flight, the Google YouTube subscriber campaign, and the Amazon Sponsored Brands Video. Amazon ran from mid-May to the end of the Season.

How this maps to the bonus

BasisBlended D2C ROAS, sales campaigns
Revenue sourcePlatform-reported sales
Season windowJan 1 to Jun 30, 2026
Blended ROAS3.19x
GA4 de-dup reference1.89x
Goal 1 tier4.00x
Tier reachedBelow Goal 1
Measured on platform-reported sales for the sales campaigns, the Season lands at 3.19x. The GA4 de-duplicated reading of 1.89x is the lower bound once cross-channel overlap is removed. Both stay under the 4.00x tier, so the result is Below Goal 1 on either basis.

Method and honest read

What this basis is. This chapter uses each platform's own reported sales, summed across Google, Meta, and Amazon, divided by the spend on sales campaigns only. It answers the question you asked: revenue net of shipping and tax, divided by total performance ad spend. The one nuance worth stating for sign-off is that these are self-reported, channel-by-channel sales, so the same order can be claimed by more than one platform and can overlap with organic or direct. That is why the platform total of 3.19x sits above the GA4 de-duplicated reading of 1.89x, which assigns each order to a single source.
What is in and out. In: media spend on sales campaigns built to drive D2C purchases, and the sales each platform attributes to those campaigns. Out: awareness and traffic campaigns and their spend, the YouTube subscriber campaign, the Amazon Sponsored Brands Video, platform and software fees, agency fees, and taxes, shipping, and handling. Returns and refunds are netted within store revenue.
The gap to Goal 1. At the sales spend of $163,518, the 4.00x tier needs about $654,000 in attributed sales. The platform basis is roughly $132,000 short of that, and the de-duplicated basis is further short. Google and Amazon Sponsored Products both cleared 4.0x; Meta at 2.01x is the single channel holding the blend below target, driven by a heavier testing share and a softer average order value as the Season scaled.
This methodology is written to be signed off before any bonus claim. June covers Jan 1 to Jun 28; Jun 29 and 30 are not yet in the data and will not move the tier.
12

Total ad spend

All channels, performance and awareness · Google, Meta, Amazon · Season 3
Total Season ad spend
$195,631
Verified platform billing across Google, Meta, and Amazon for Jan 1 to Jun 30. This is every advertising dollar, before the split into performance and awareness.
Performance spend
$163,518
84 percent of the total. Sales campaigns.
Awareness spend
$32,115
16 percent. Traffic, subscribers, brand video.

Total ad spend, split into performance and awareness

Performance · $163,518
Awareness · $32,115
Performance: sales campaigns that drive D2C purchases (counted in the ROAS KPI) Awareness: traffic, subscriber, and brand-video campaigns (excluded from the ROAS KPI)
Of the $195,631 total, roughly five out of every six dollars went to sales-driving campaigns. The awareness slice is the Meta brand-traffic flight, the Google YouTube subscriber campaign, and the Amazon Sponsored Brands Video. Keeping the two separate is what lets the ROAS bonus be measured on performance spend alone.

Spend by channel and type

ChannelPerformanceAwarenessTotalShare of total
Meta$67,944$30,622$98,56650.4%
Google Ads$93,949$872$94,82148.5%
Amazon$1,624$621$2,2441.1%
Total$163,518$32,115$195,631100%
Meta and Google carried almost all of the budget at roughly half each, with Amazon a small late-Season addition. Nearly all of the awareness spend sits in Meta, which ran the brand-traffic flight from May 29. Google's awareness line is the YouTube subscriber campaign, and Amazon's is the Sponsored Brands Video.

Google Ads campaigns

CampaignTypeGoalSpendCTRRole
LB_EV_PMAX_80FFPCPPerformance MaxPurchase$44,4953.04%Performance
LB_EV_BRAND_SEARCHSearch, brandPurchase$26,9729.84%Performance
Pmax - TestPerformance MaxPurchase$20,1691.74%Performance
Performance MaxPerformance MaxPurchase$2,1223.48%Performance
Sales-Shopping-2ShoppingPurchase$1911.09%Performance
Youtube SubscriptionVideoSubscribers$8721.33%Awareness
Google account spend was $94,821, with $93,949 in the five purchase-goal campaigns. PMAX on the ceramic-pot 80FFPCP line was the largest single spend; brand search converted hardest at a 9.84 percent click rate. Only the YouTube subscriber campaign is treated as awareness.

Meta campaigns

CampaignObjectiveSpendSalesROASRole
LB_AWARENESS_META_TRAFFICTraffic$30,281$1000.00xAwareness
Shopify Audience AdsSales$23,904$50,6312.12xPerformance
LB_EV_META_80FFPCP_ProspectingSales$16,939$29,2951.73xPerformance
LB_EV_META_80FFPCP_RetargettingSales$6,673$11,0151.65xPerformance
LB_MD26_PURCHASE_80FFPCPSales$5,605$9,5591.71xPerformance
Maria - Existing Post CampaignSales$5,480$7,8771.44xPerformance
Test ShopifySales$3,515$9,9242.82xPerformance
Shopify Audience Ads (Shopify)Sales$3,133$8,3032.65xPerformance
Test ShopSales$2,335$7,6843.29xPerformance
Post: "Why wait a month for your garden to glow?"Sales$360$2,0185.61xPerformance
Post: "A gift for Mom."Traffic$341$00.00xAwareness
Meta account spend was $98,566, split into $67,944 of performance across nine sales campaigns and $30,622 of awareness across two traffic campaigns. Shopify Audience Ads was the largest single sales campaign at $23,904; the boosted post "Why wait a month" was the most efficient at 5.61x on a small budget. The awareness side is dominated by LB_AWARENESS_META_TRAFFIC, the brand-traffic flight launched May 29 to lift engaged visitors; with a traffic objective and effectively no sales, it is excluded from the ROAS denominator.
Meta performance: $67,944 to $136,306, 2.01x Meta awareness: $30,622, 197K landing-page views

Amazon Ads campaigns

CampaignTypeSpendSalesROASRole
Auto presets, 1-plant (B0GTV47JK8)SP$696$3,4935.02xPerformance
LB_EOS_SB_VIDEOSB Video$621$9201.48xAwareness
LB_EOS_SP_BRAND_EXACTSP$397$2,0885.26xPerformance
Auto presets, 2-plant (B0GTTW78MR)SP$338$4301.27xPerformance
Auto presets, 3-plant (B0GTTXZ1Q1)SP$193$6503.36xPerformance
Amazon spend was $2,244 across five campaigns running from mid-to-late May to the end of the Season, for $7,580 in reported sales. The four Sponsored Products campaigns are the performance side, led by the brand-exact campaign at 5.26x. The Sponsored Brands Video is the brand-awareness piece and is kept in the awareness bucket, so only the $1,624 of Sponsored Products spend feeds the ROAS KPI.
SP performance: $1,624 to $6,661, 4.10x SB Video awareness: $621 to $920, 1.48x

Read in one place

Total Season ad spend was $195,631. Eighty-four percent of it, $163,518, went to sales campaigns and feeds the ROAS KPI in the previous chapter. The remaining $32,115 went to awareness: the Meta brand-traffic flight that drove the late-Season visitor surge, plus a YouTube subscriber campaign and an Amazon brand video. Meta and Google split the working budget almost evenly, and Amazon came in late and small but efficient on its Sponsored Products side.
The clean separation of performance from awareness is what makes both bonus KPIs measurable on the right basis: sales spend into the ROAS reading, and the traffic flight into the engaged-visitor reading. Everything is paused now, consistent with the end-of-Season wind-down after the ceramic-pot sell-through.
13

Customer reviews (Judge.me)

All reviews collected · store zy9myt-r0 · export June 29, 2026
Published average (storefront)
4.4 / 5
Only the 830 reviews shown publicly on the site. This is a curated subset, 39% of everything collected, and it is not the full picture.
All-reviews average
2.9 / 5
Across all 2,139 reviews collected, including the 1,308 that are not published. 35% are five star.
Reviews collected
2,139
830 published, 1,308 not published, 1 deleted.
Published (shown)
830
Not published
1,308
Not-published avg
2.0
In contract Season (2026)
449

The full review pipeline · what is shown versus what is held back

Published 830
Not published 1308
Published 830 (38.8%) Not published 1,308 (61.1%) Deleted 1

Published reviews · rating mix (n=830, avg 4.4)

5 ★
634
4 ★
61
3 ★
25
2 ★
32
1 ★
78

Not-published reviews · rating mix (n=1,308, avg 2.0)

5 ★
123
4 ★
67
3 ★
180
2 ★
228
1 ★
710
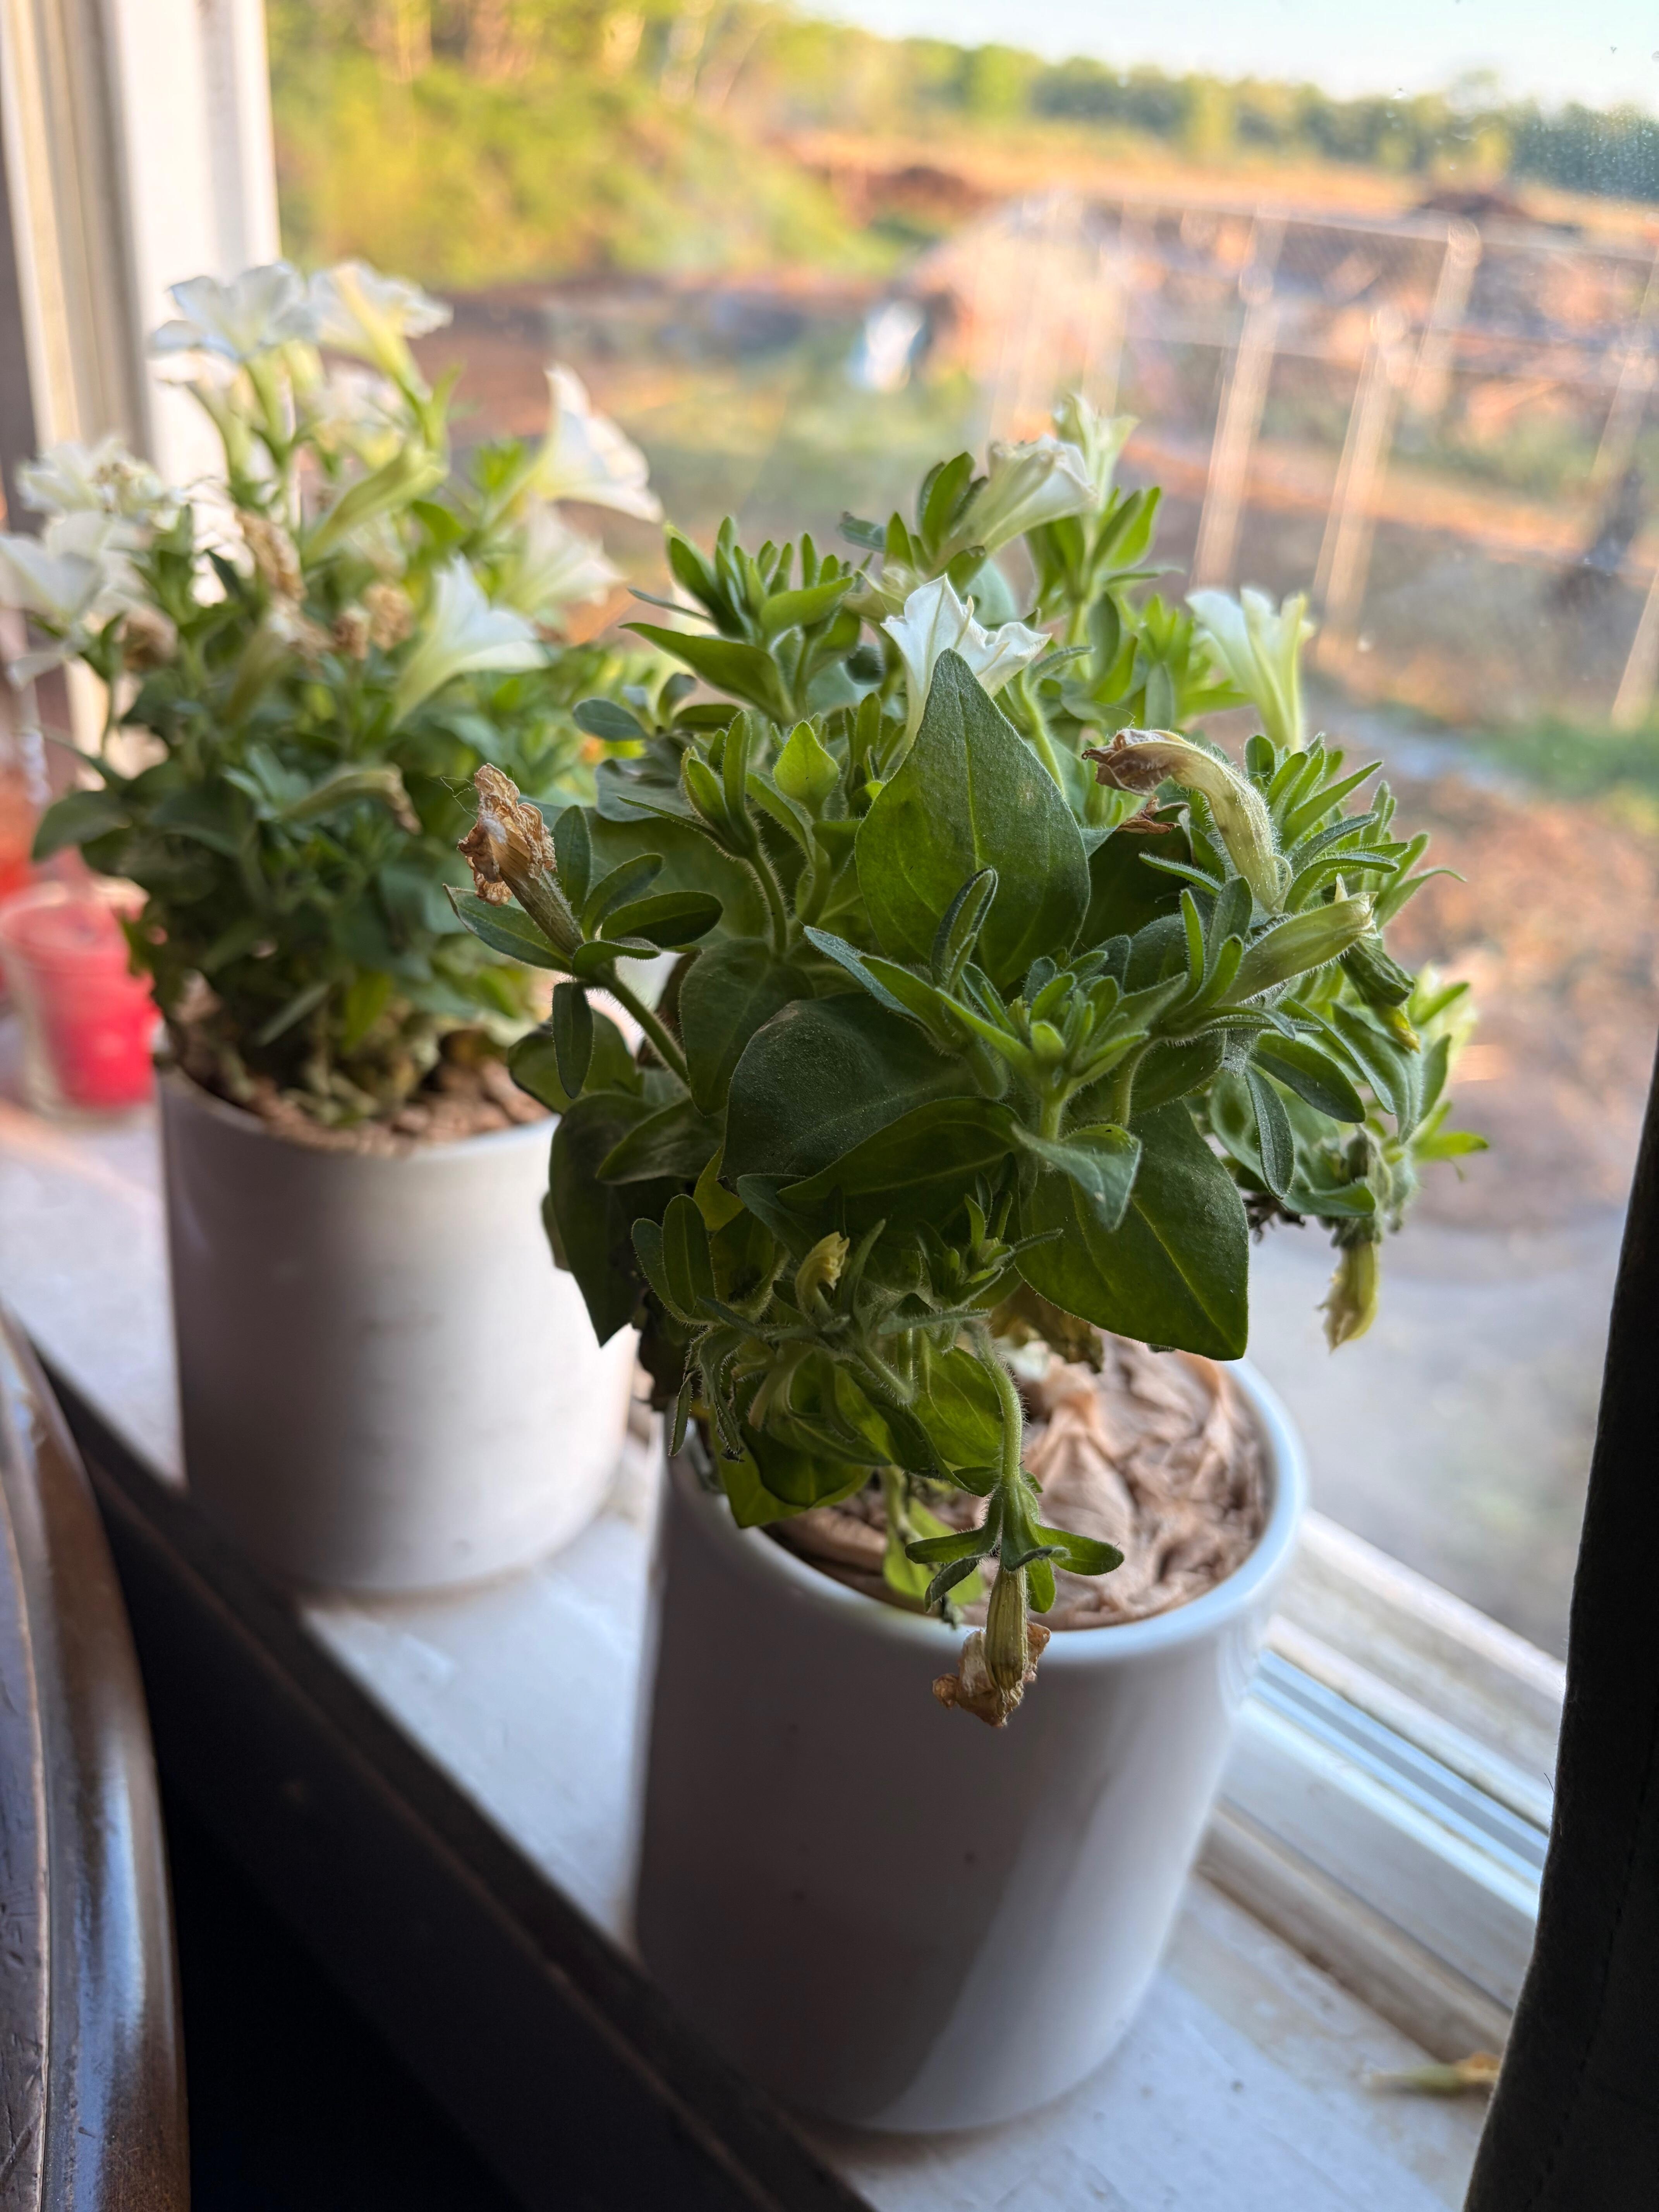
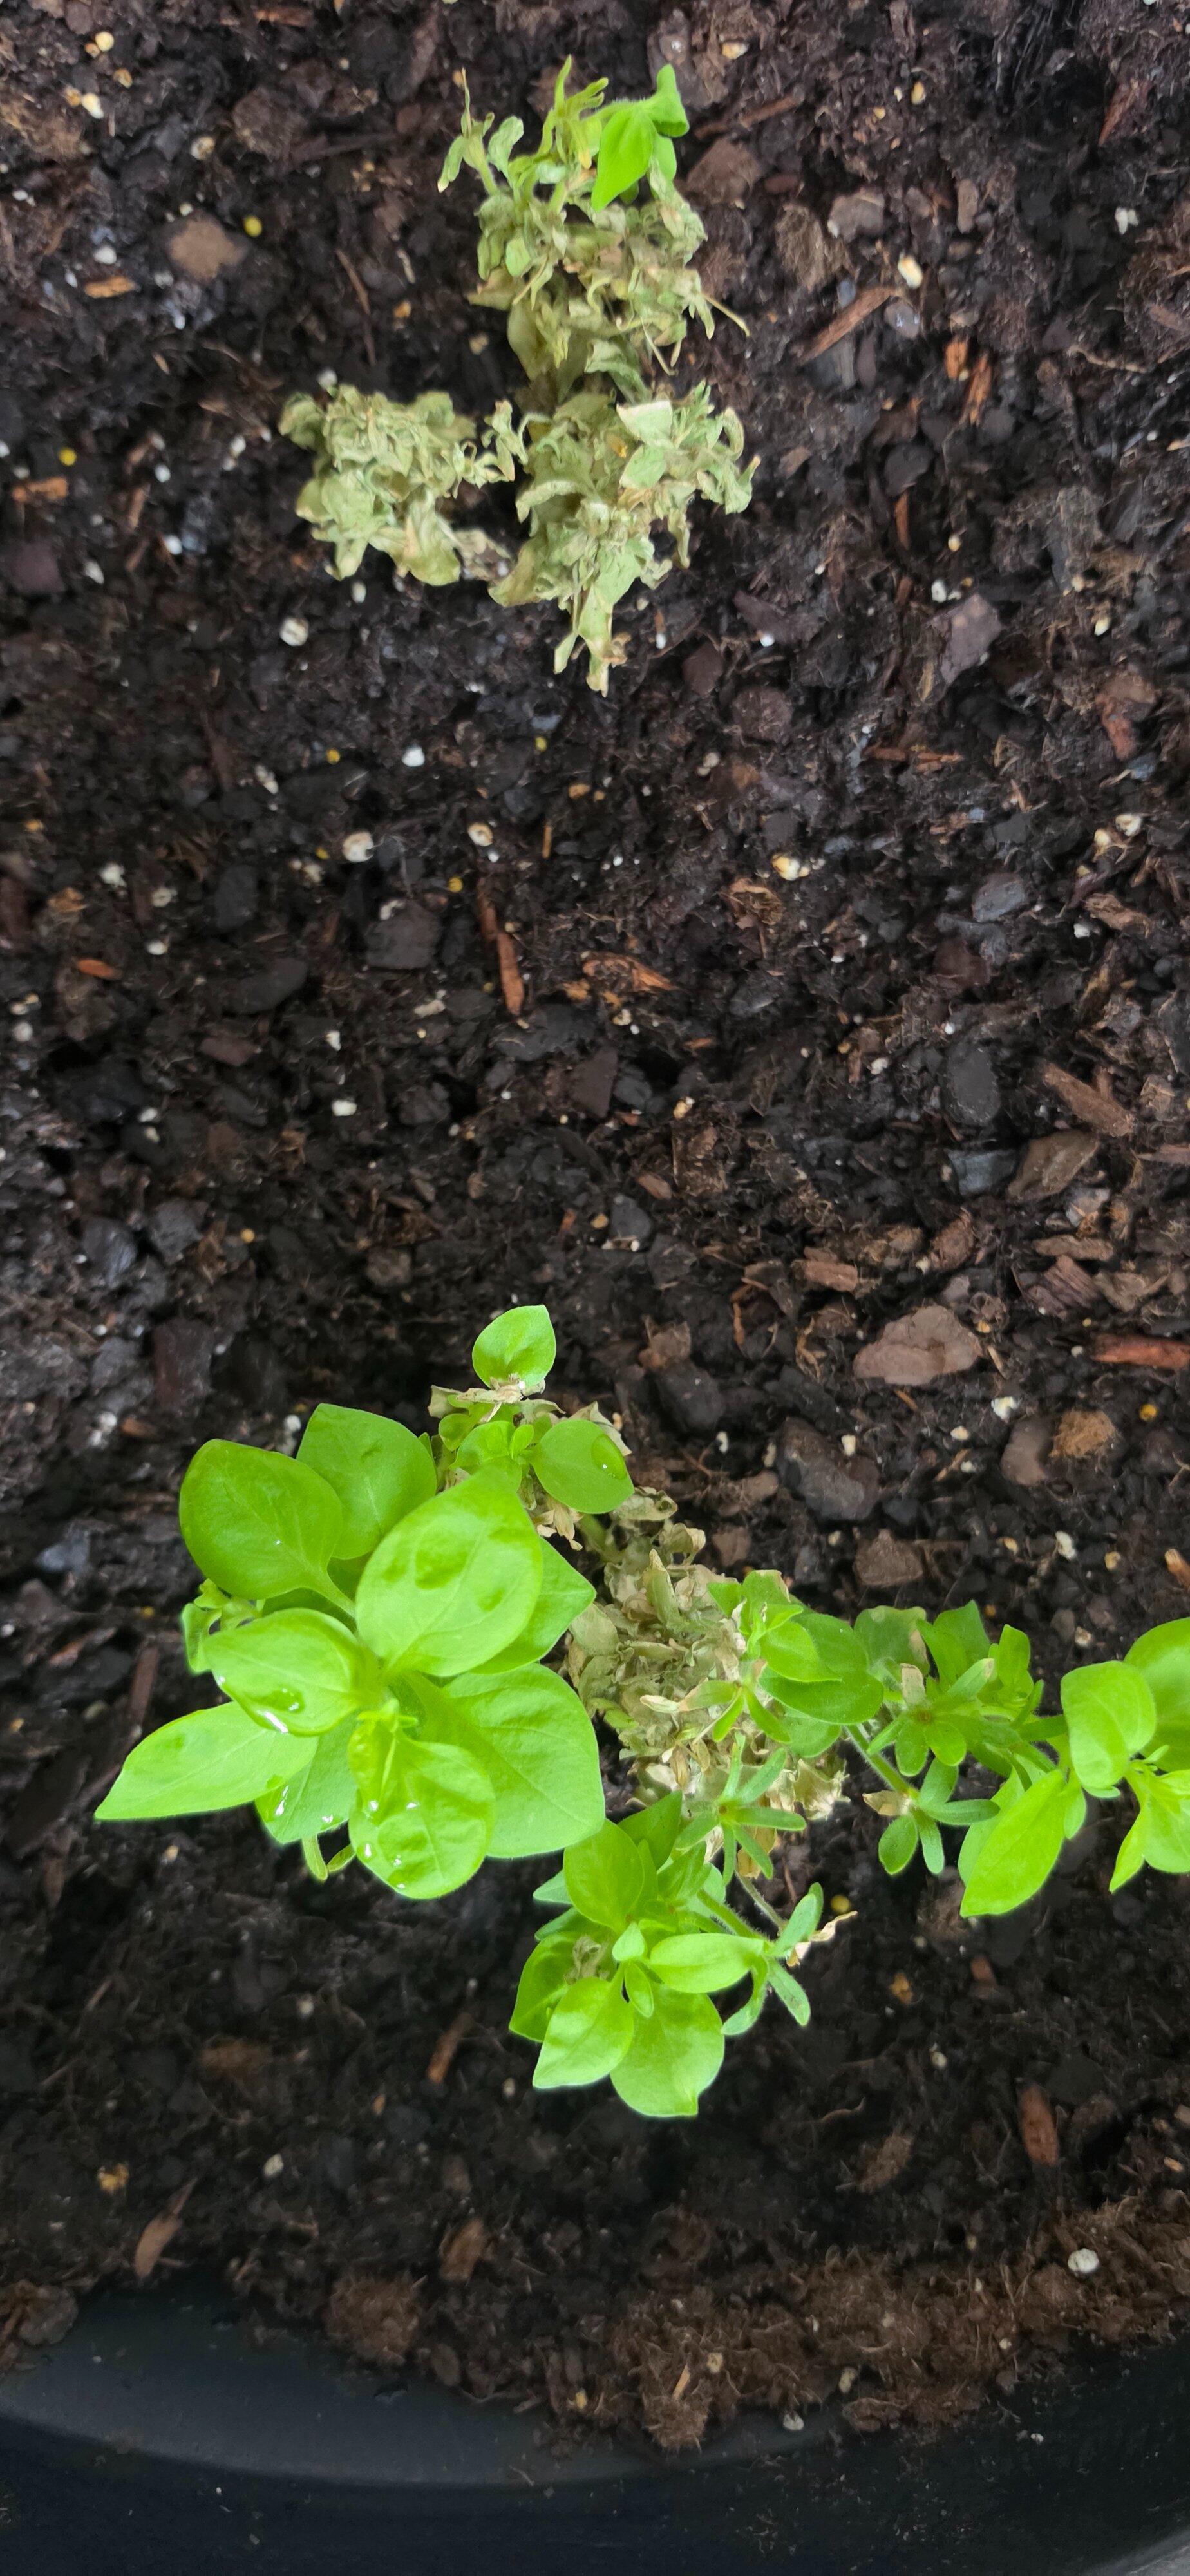
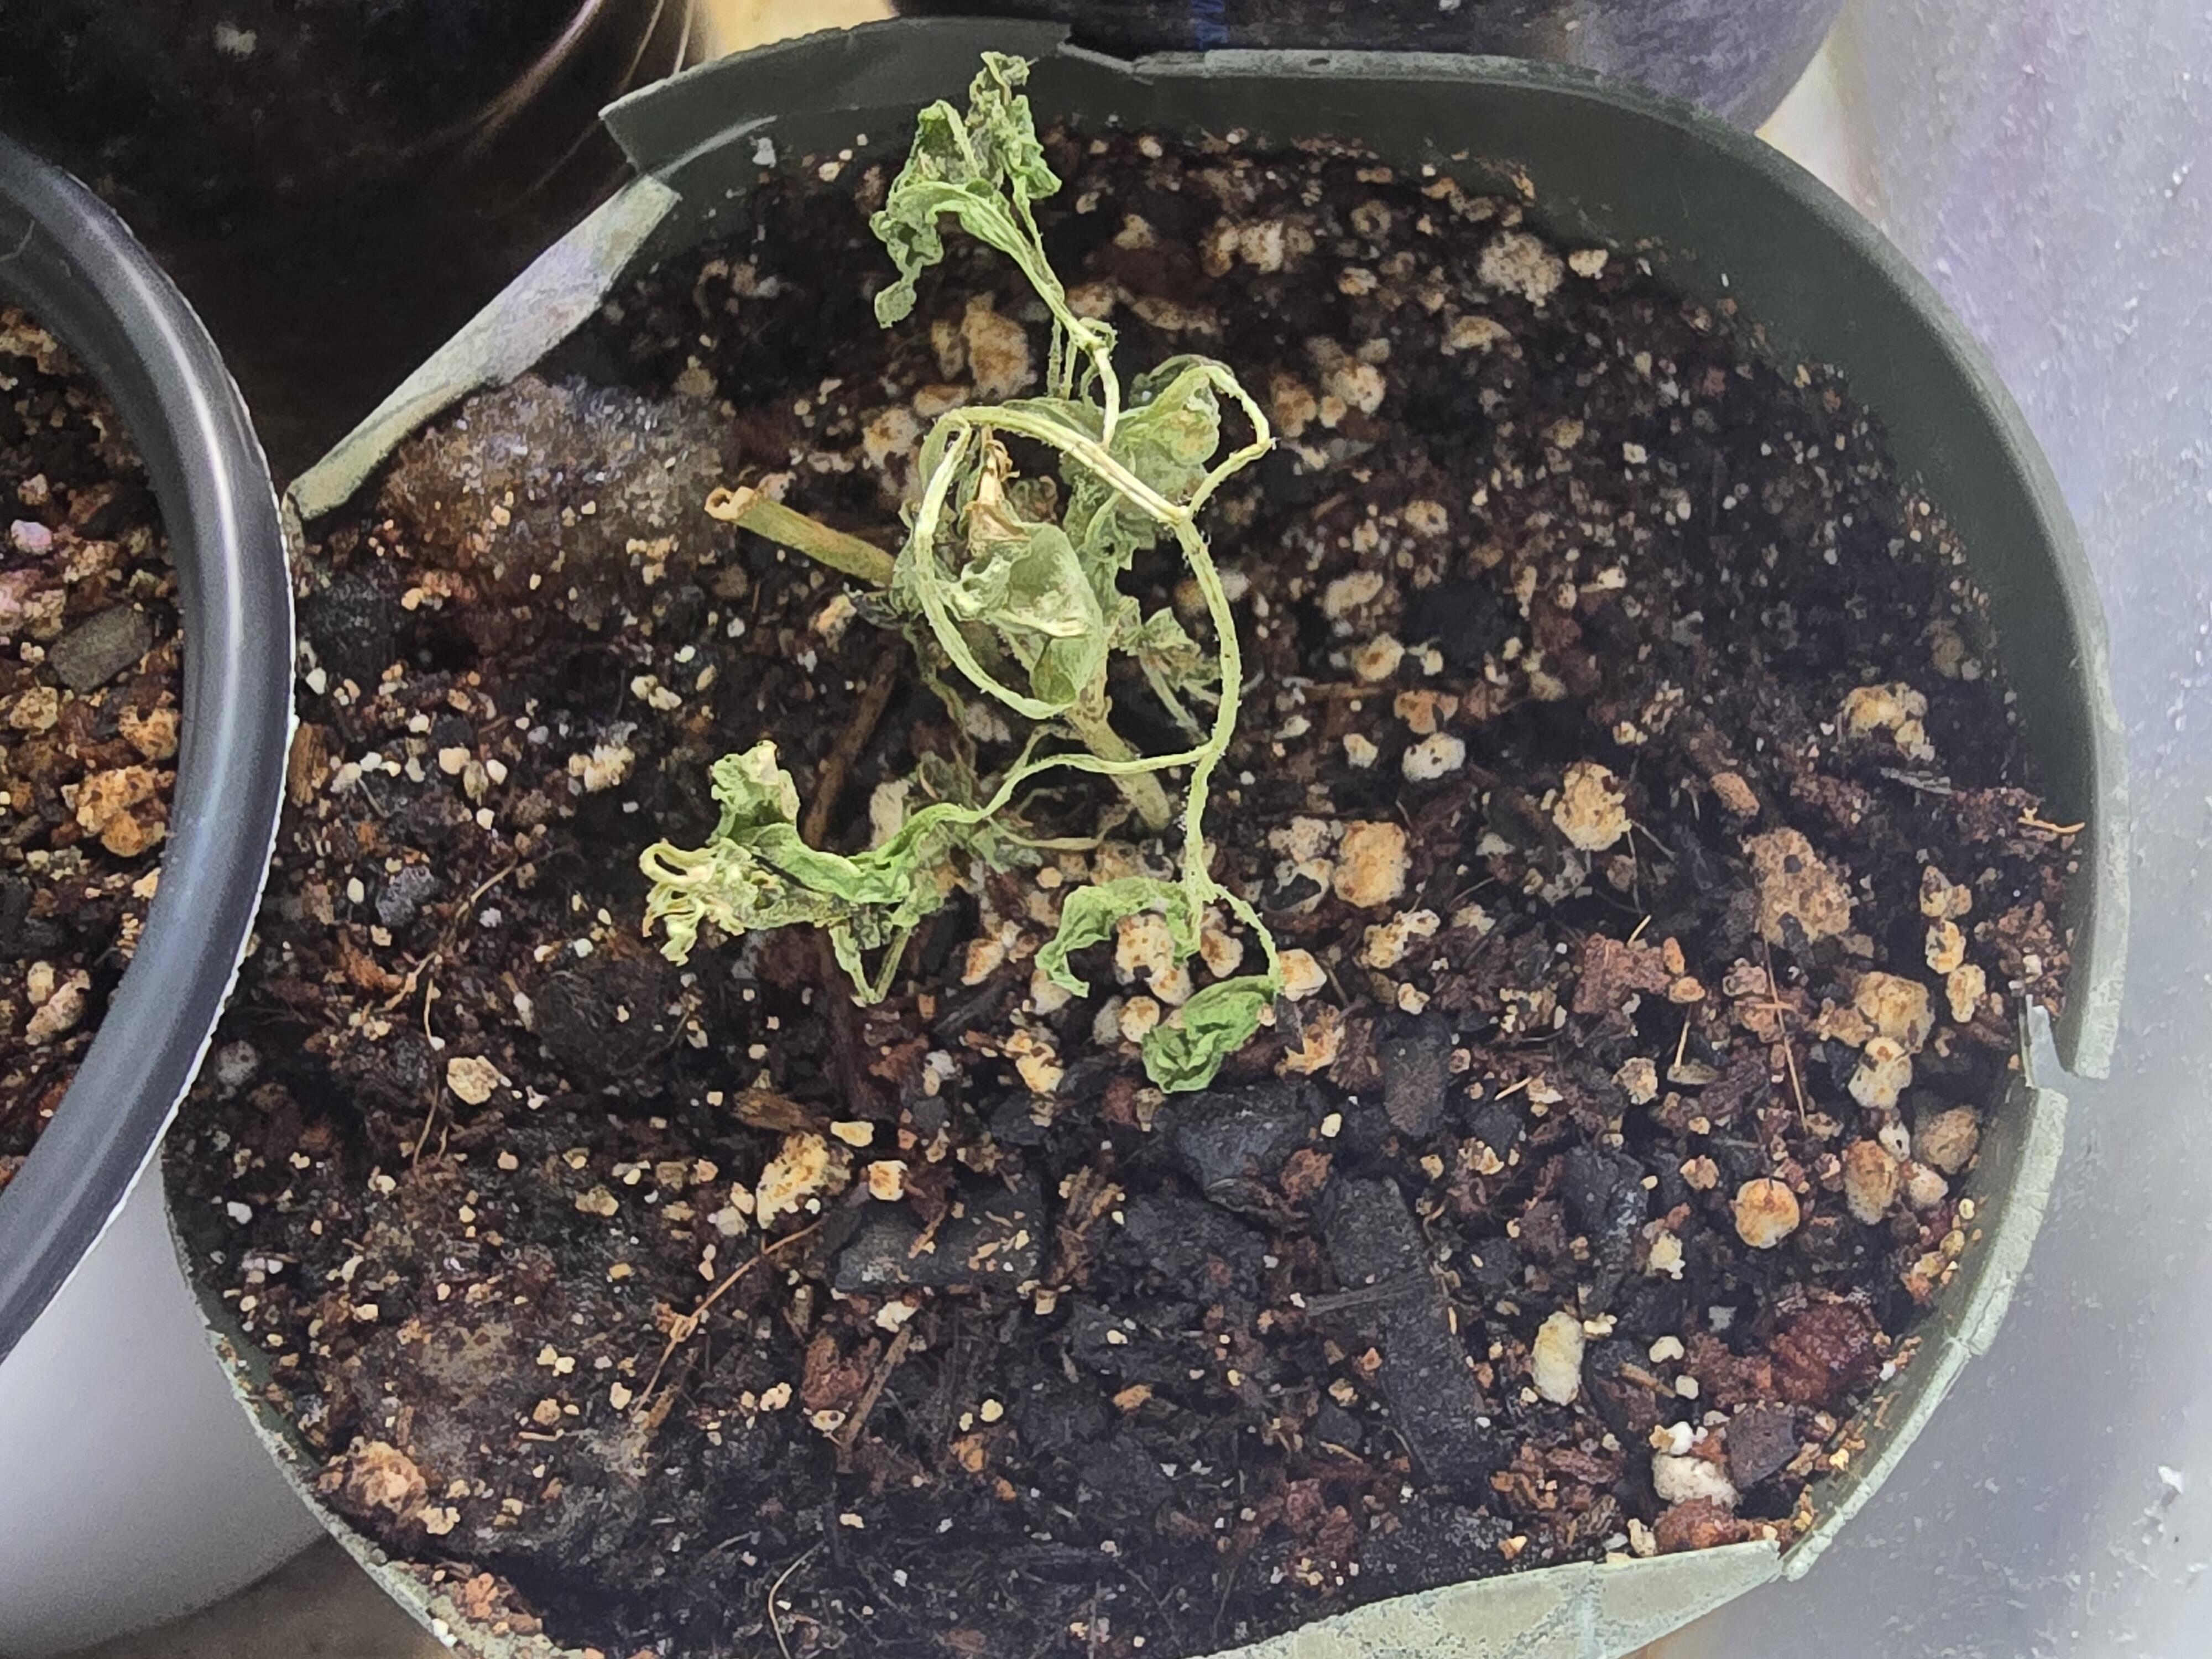
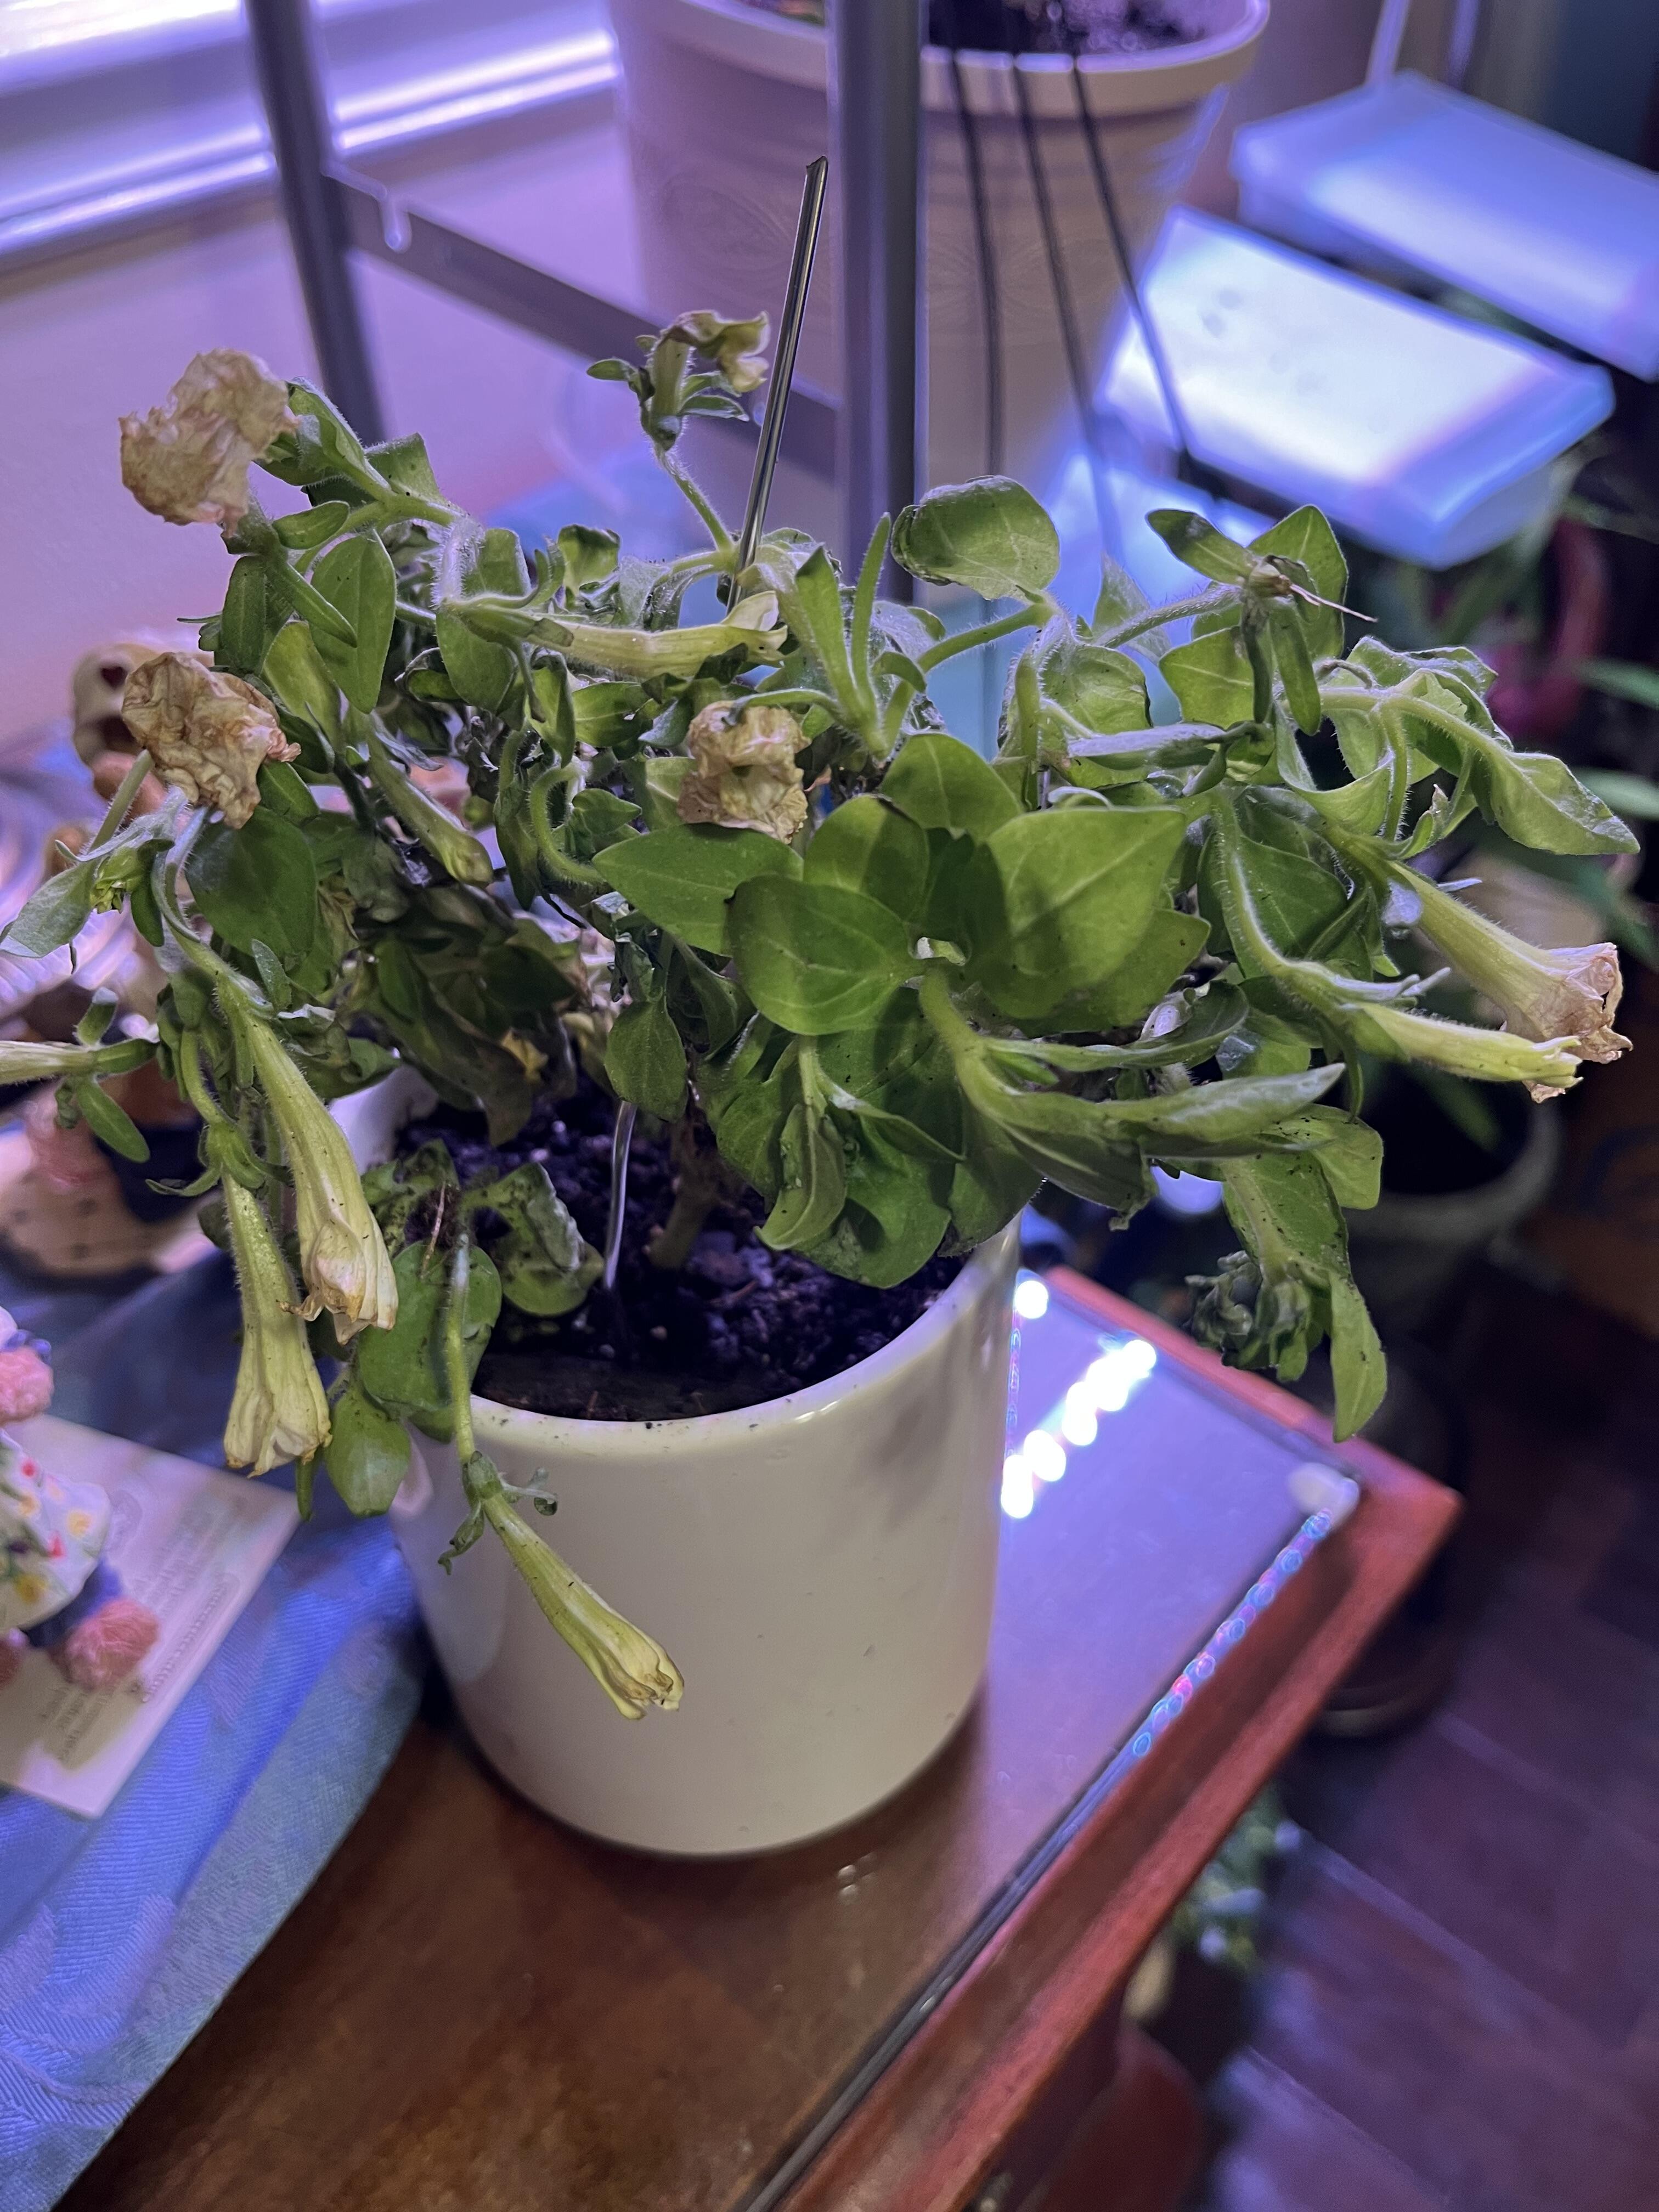
Read this honestly. The 1,308 not-published reviews are flagged "spam" in Judge.me, but the data says otherwise: every one has a reviewer email, almost all have a US location and written feedback, none contain links or foreign-language gibberish, and 858 came through the same post-purchase request email that produced the published reviews. They are genuine customer reviews, and they skew sharply negative at a 2.0 average, mostly about plants arriving dead or damaged and not glowing. The cause of the spam flag is not visible in the export, it could be an over-aggressive auto-filter or a moderation setting, and it is worth checking directly in Judge.me. Two implications: the storefront 4.4 is a filtered number, and the arrival-condition problem is far larger than the published reviews alone suggest. There may also be an FTC review-rule angle worth confirming, since genuine negative reviews should not be suppressed.

A sample of the not-published feedback, reproduced as written and clearly labeled

★★★★withheld
There is no glowing what soever.
Gary R.arrival / glow
★★★★★withheld
2 Petunias were uprooted from their pots and therefore dead. One additional is struggling. Very dry upon arrival. Received 6 and likely only be able to salvage 3. I would
Shawna R.arrival / glow
★★★★withheld
I'm really disappointed. They just look like white flowers in the dark. My husband says I've been scammed.
Brittney C.arrival / glow
★★★★★withheld
Not sure if it's because of the shipping process or before but looks a bit wilted and tattered. Potted it right away and hopefully it rebounds
Carlarrival / glow

Customer photos · a sample of the 393 photos on published reviews
4 to 5 stars 3 stars 1 to 2 stars Tap any photo to open the full image
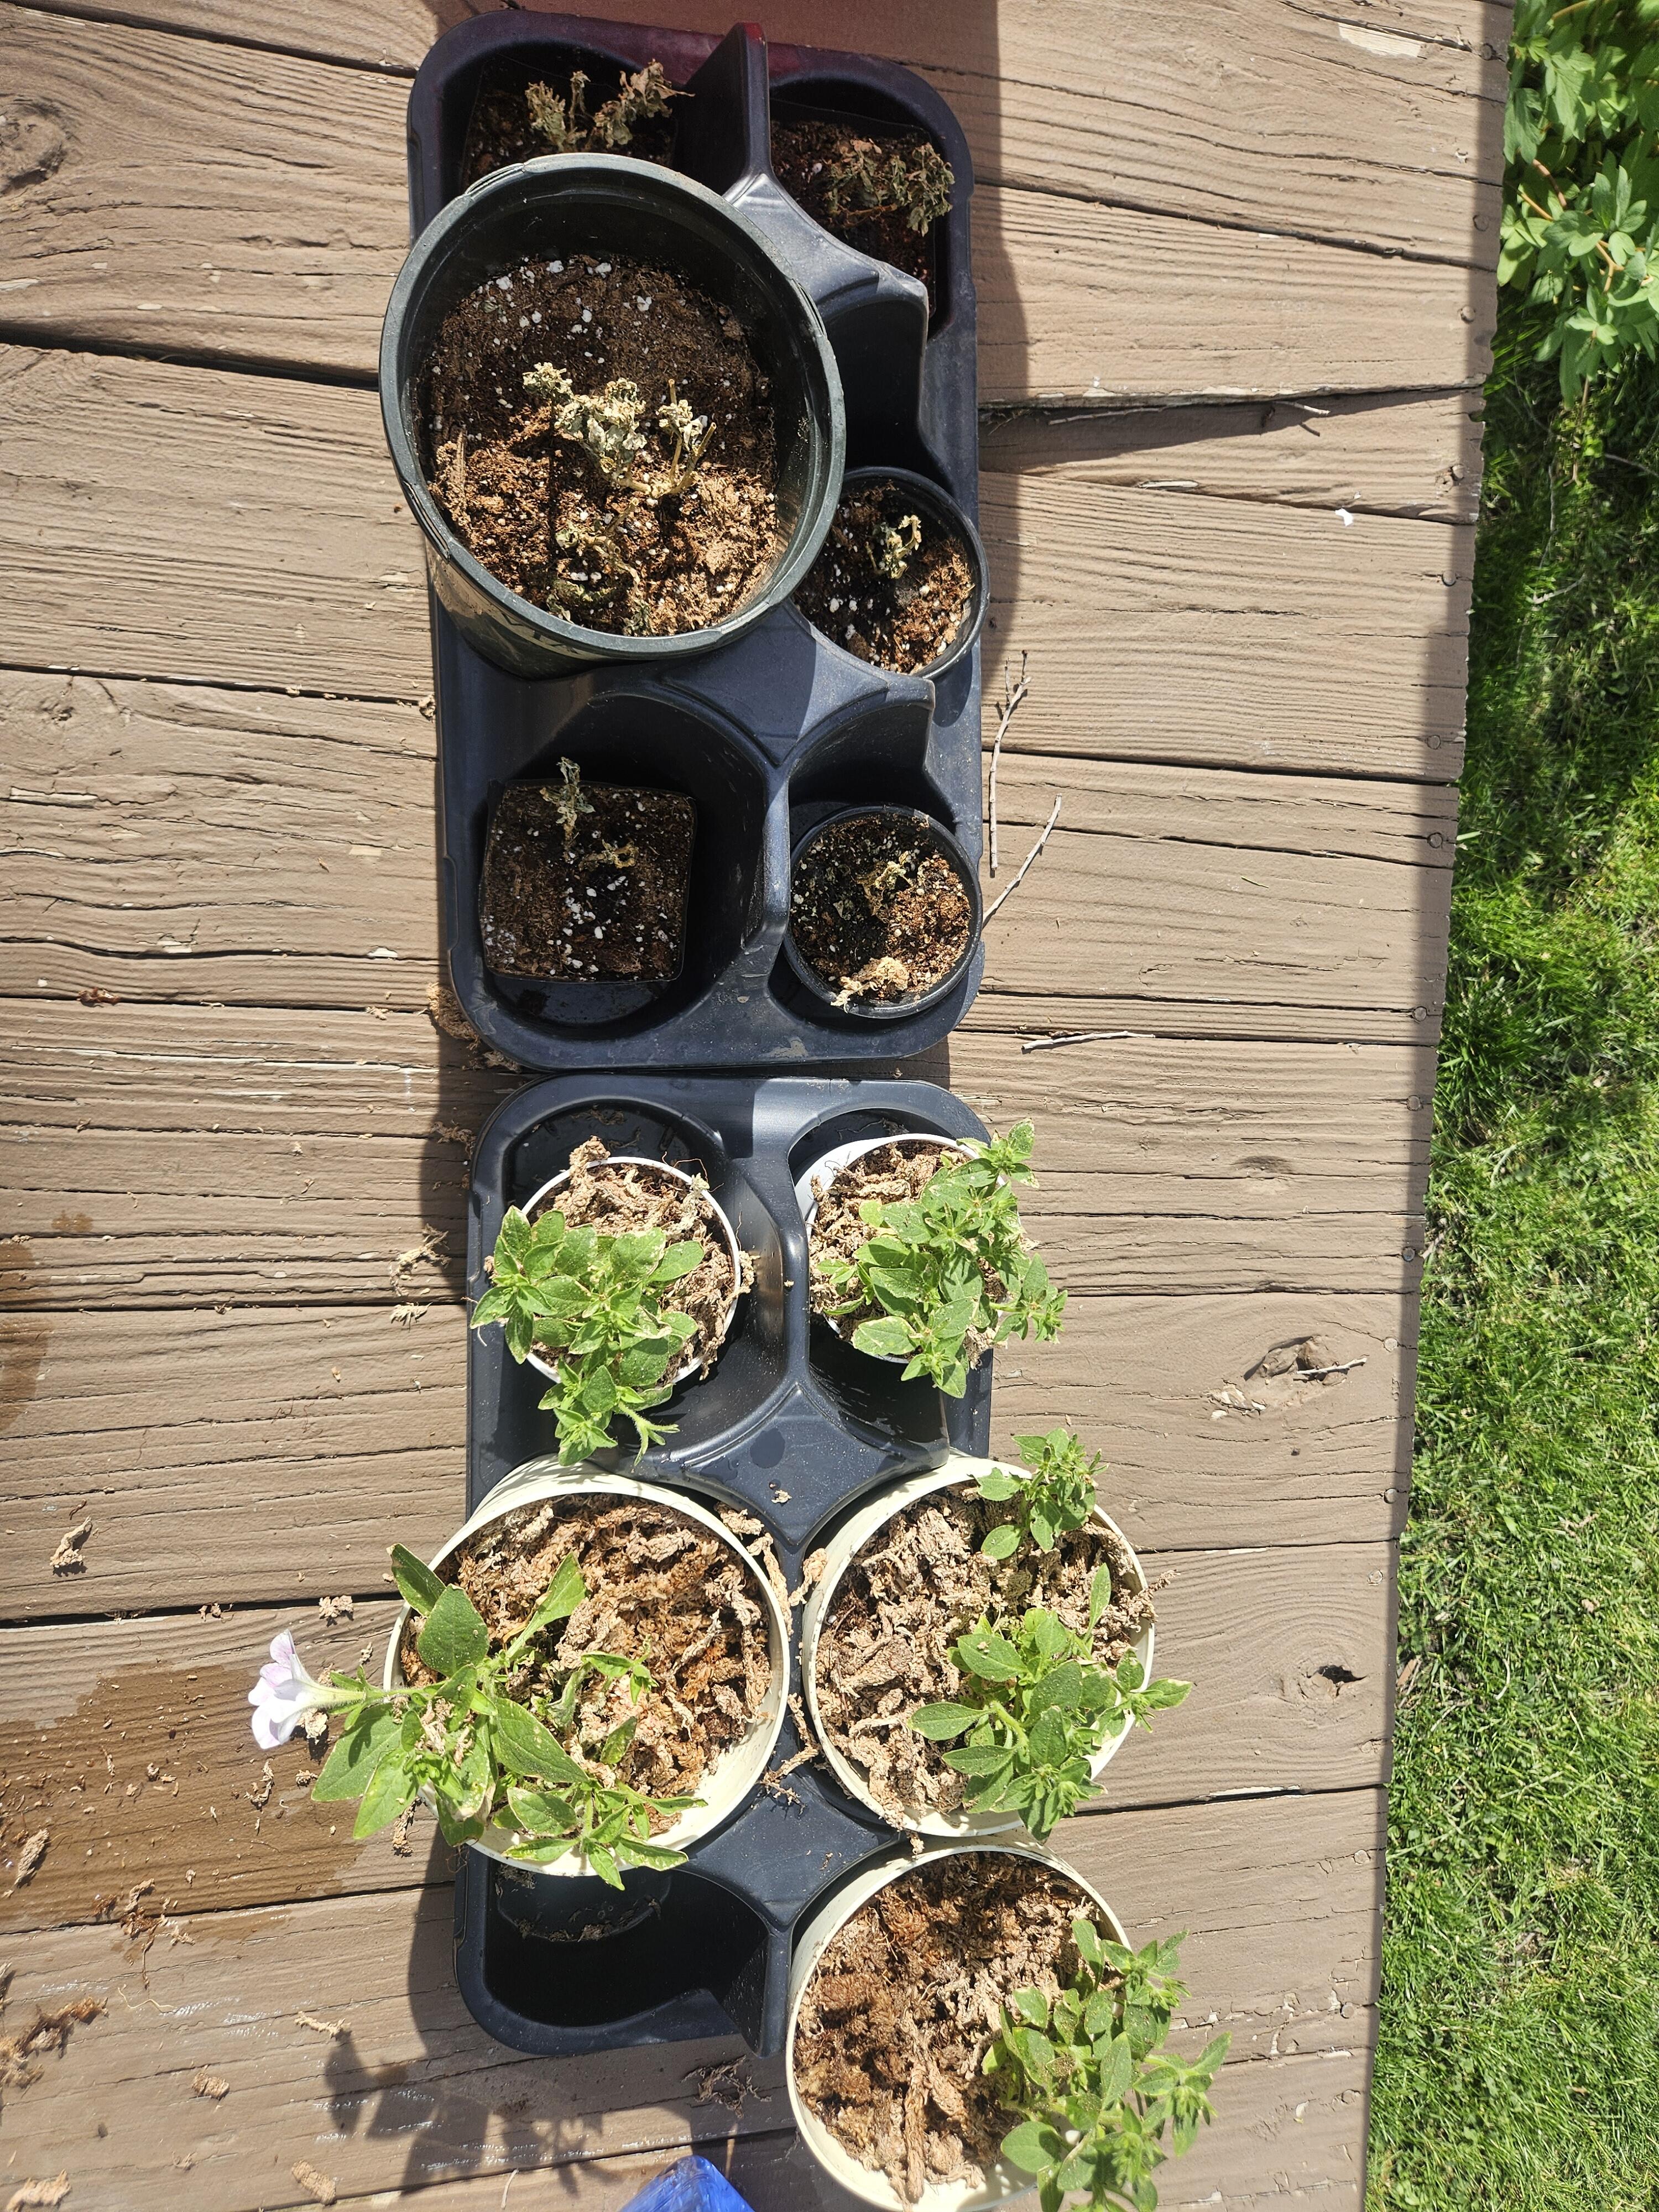
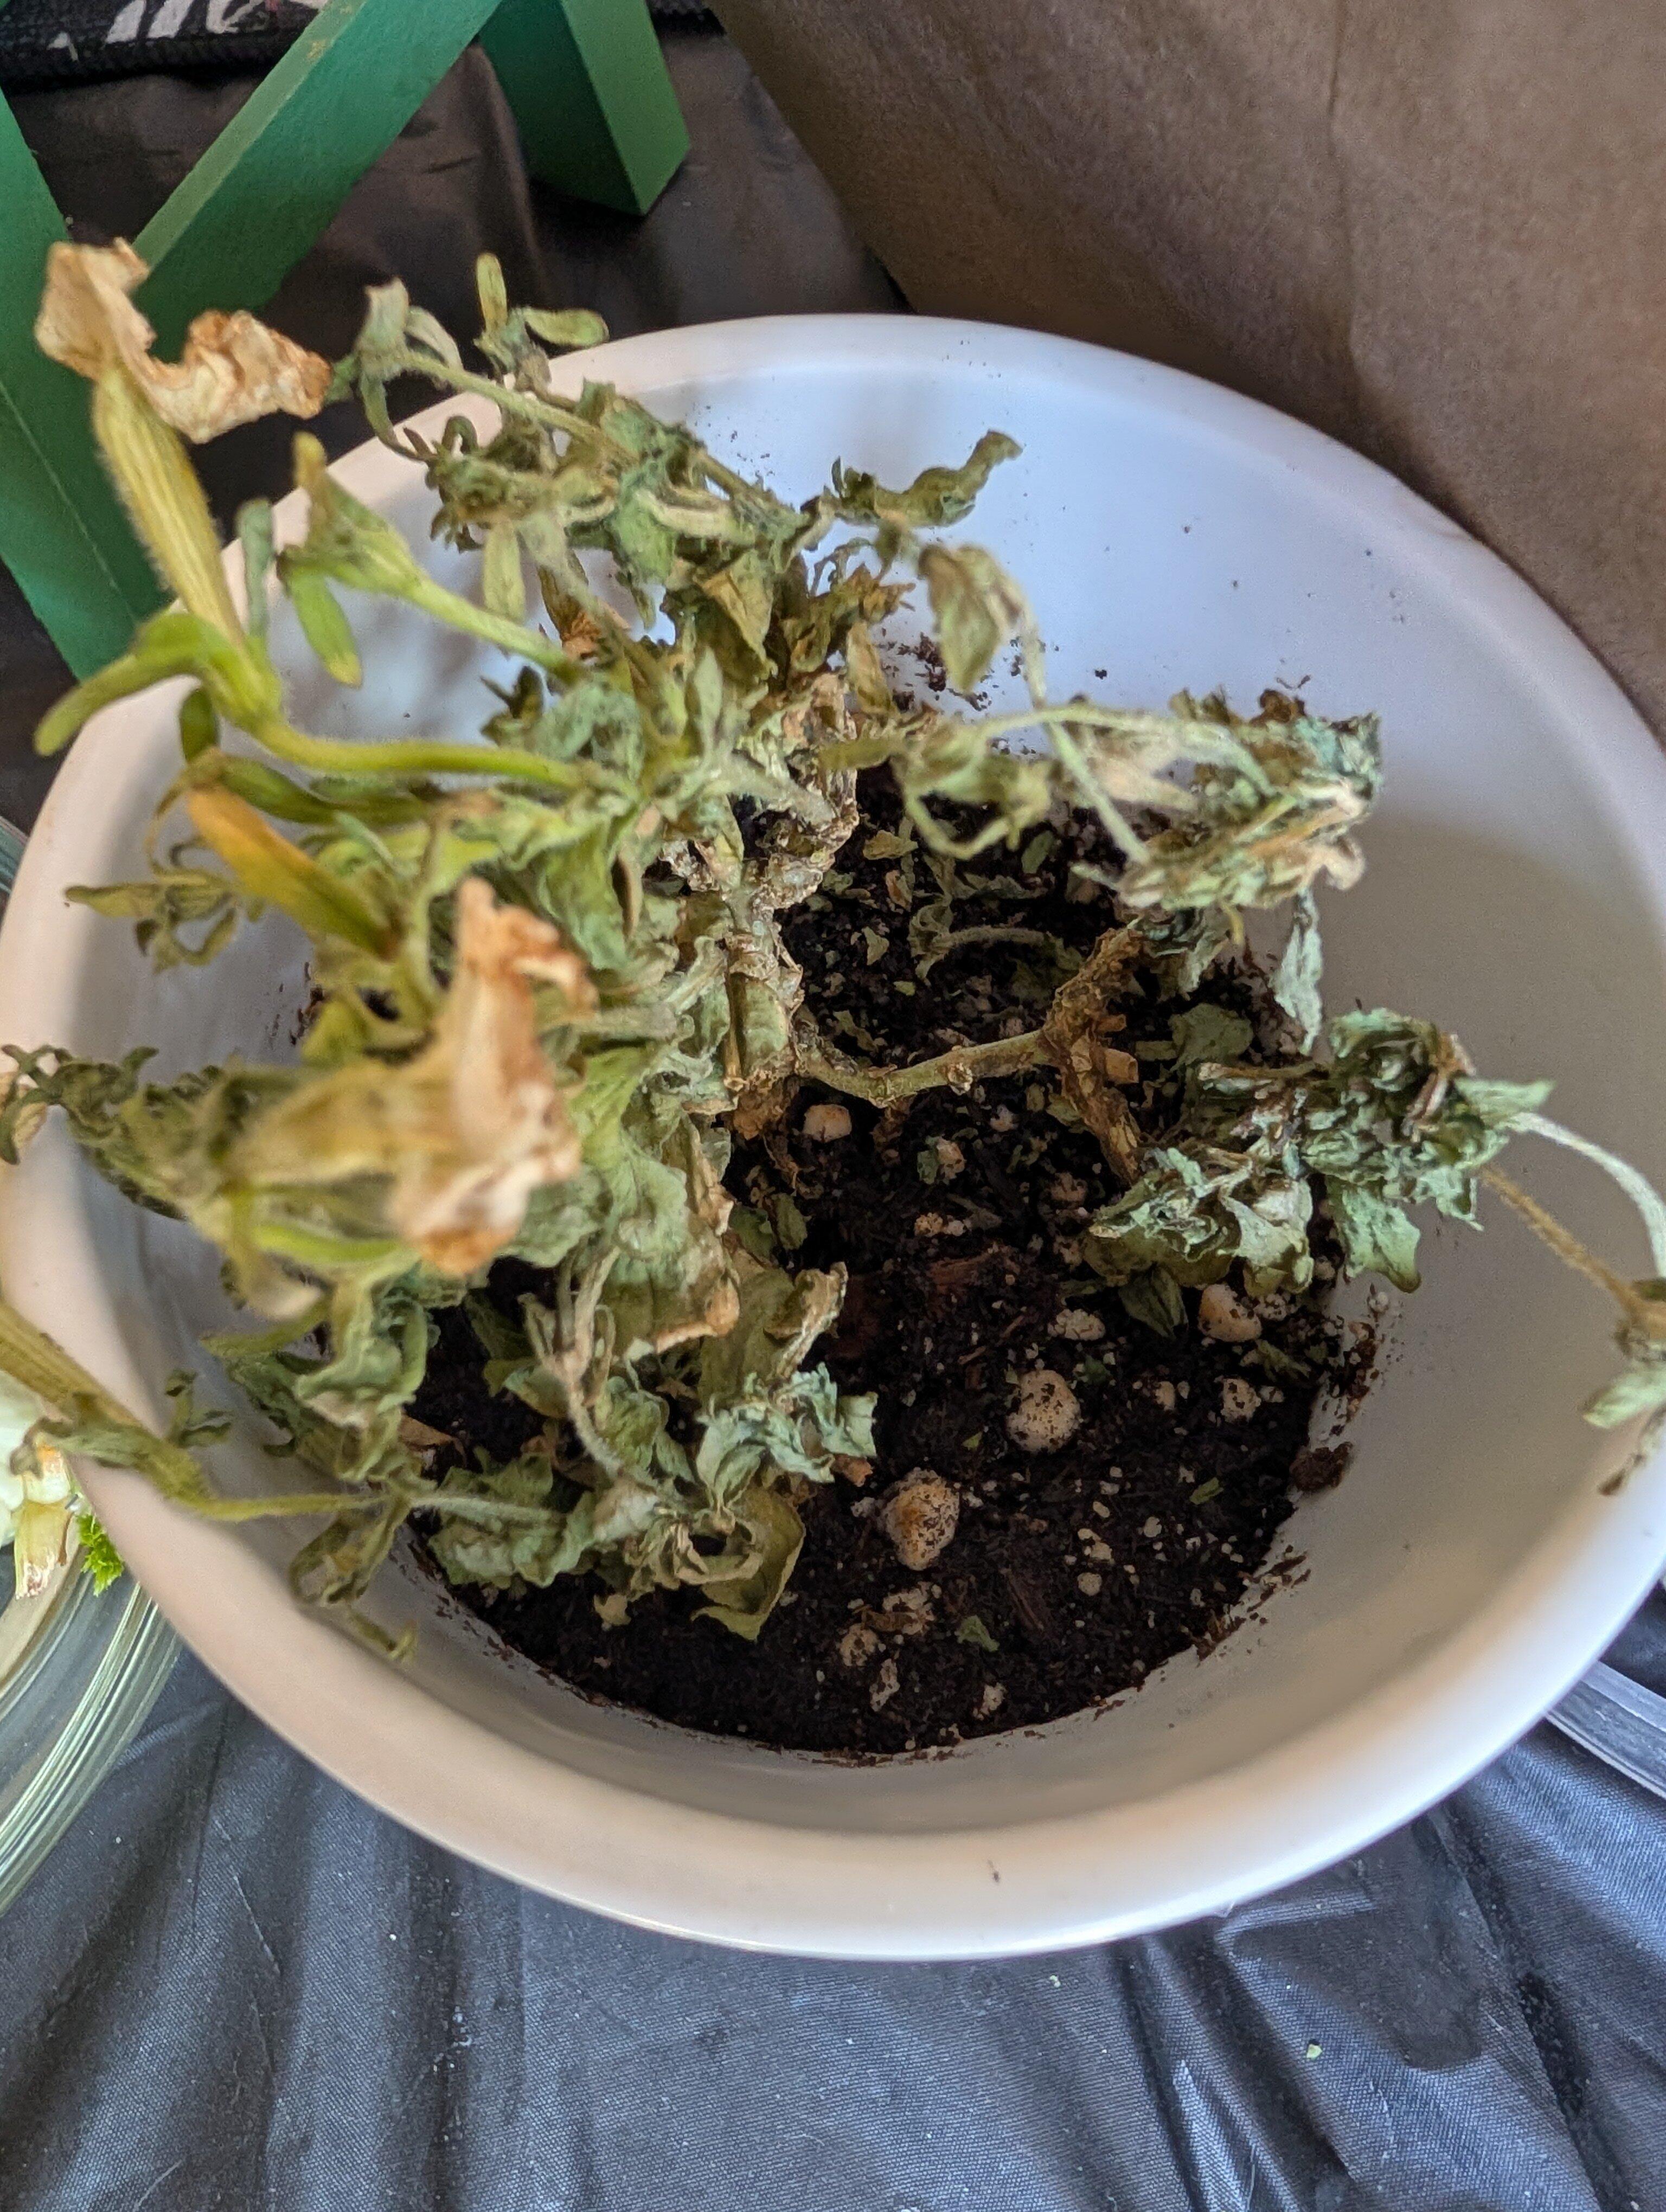
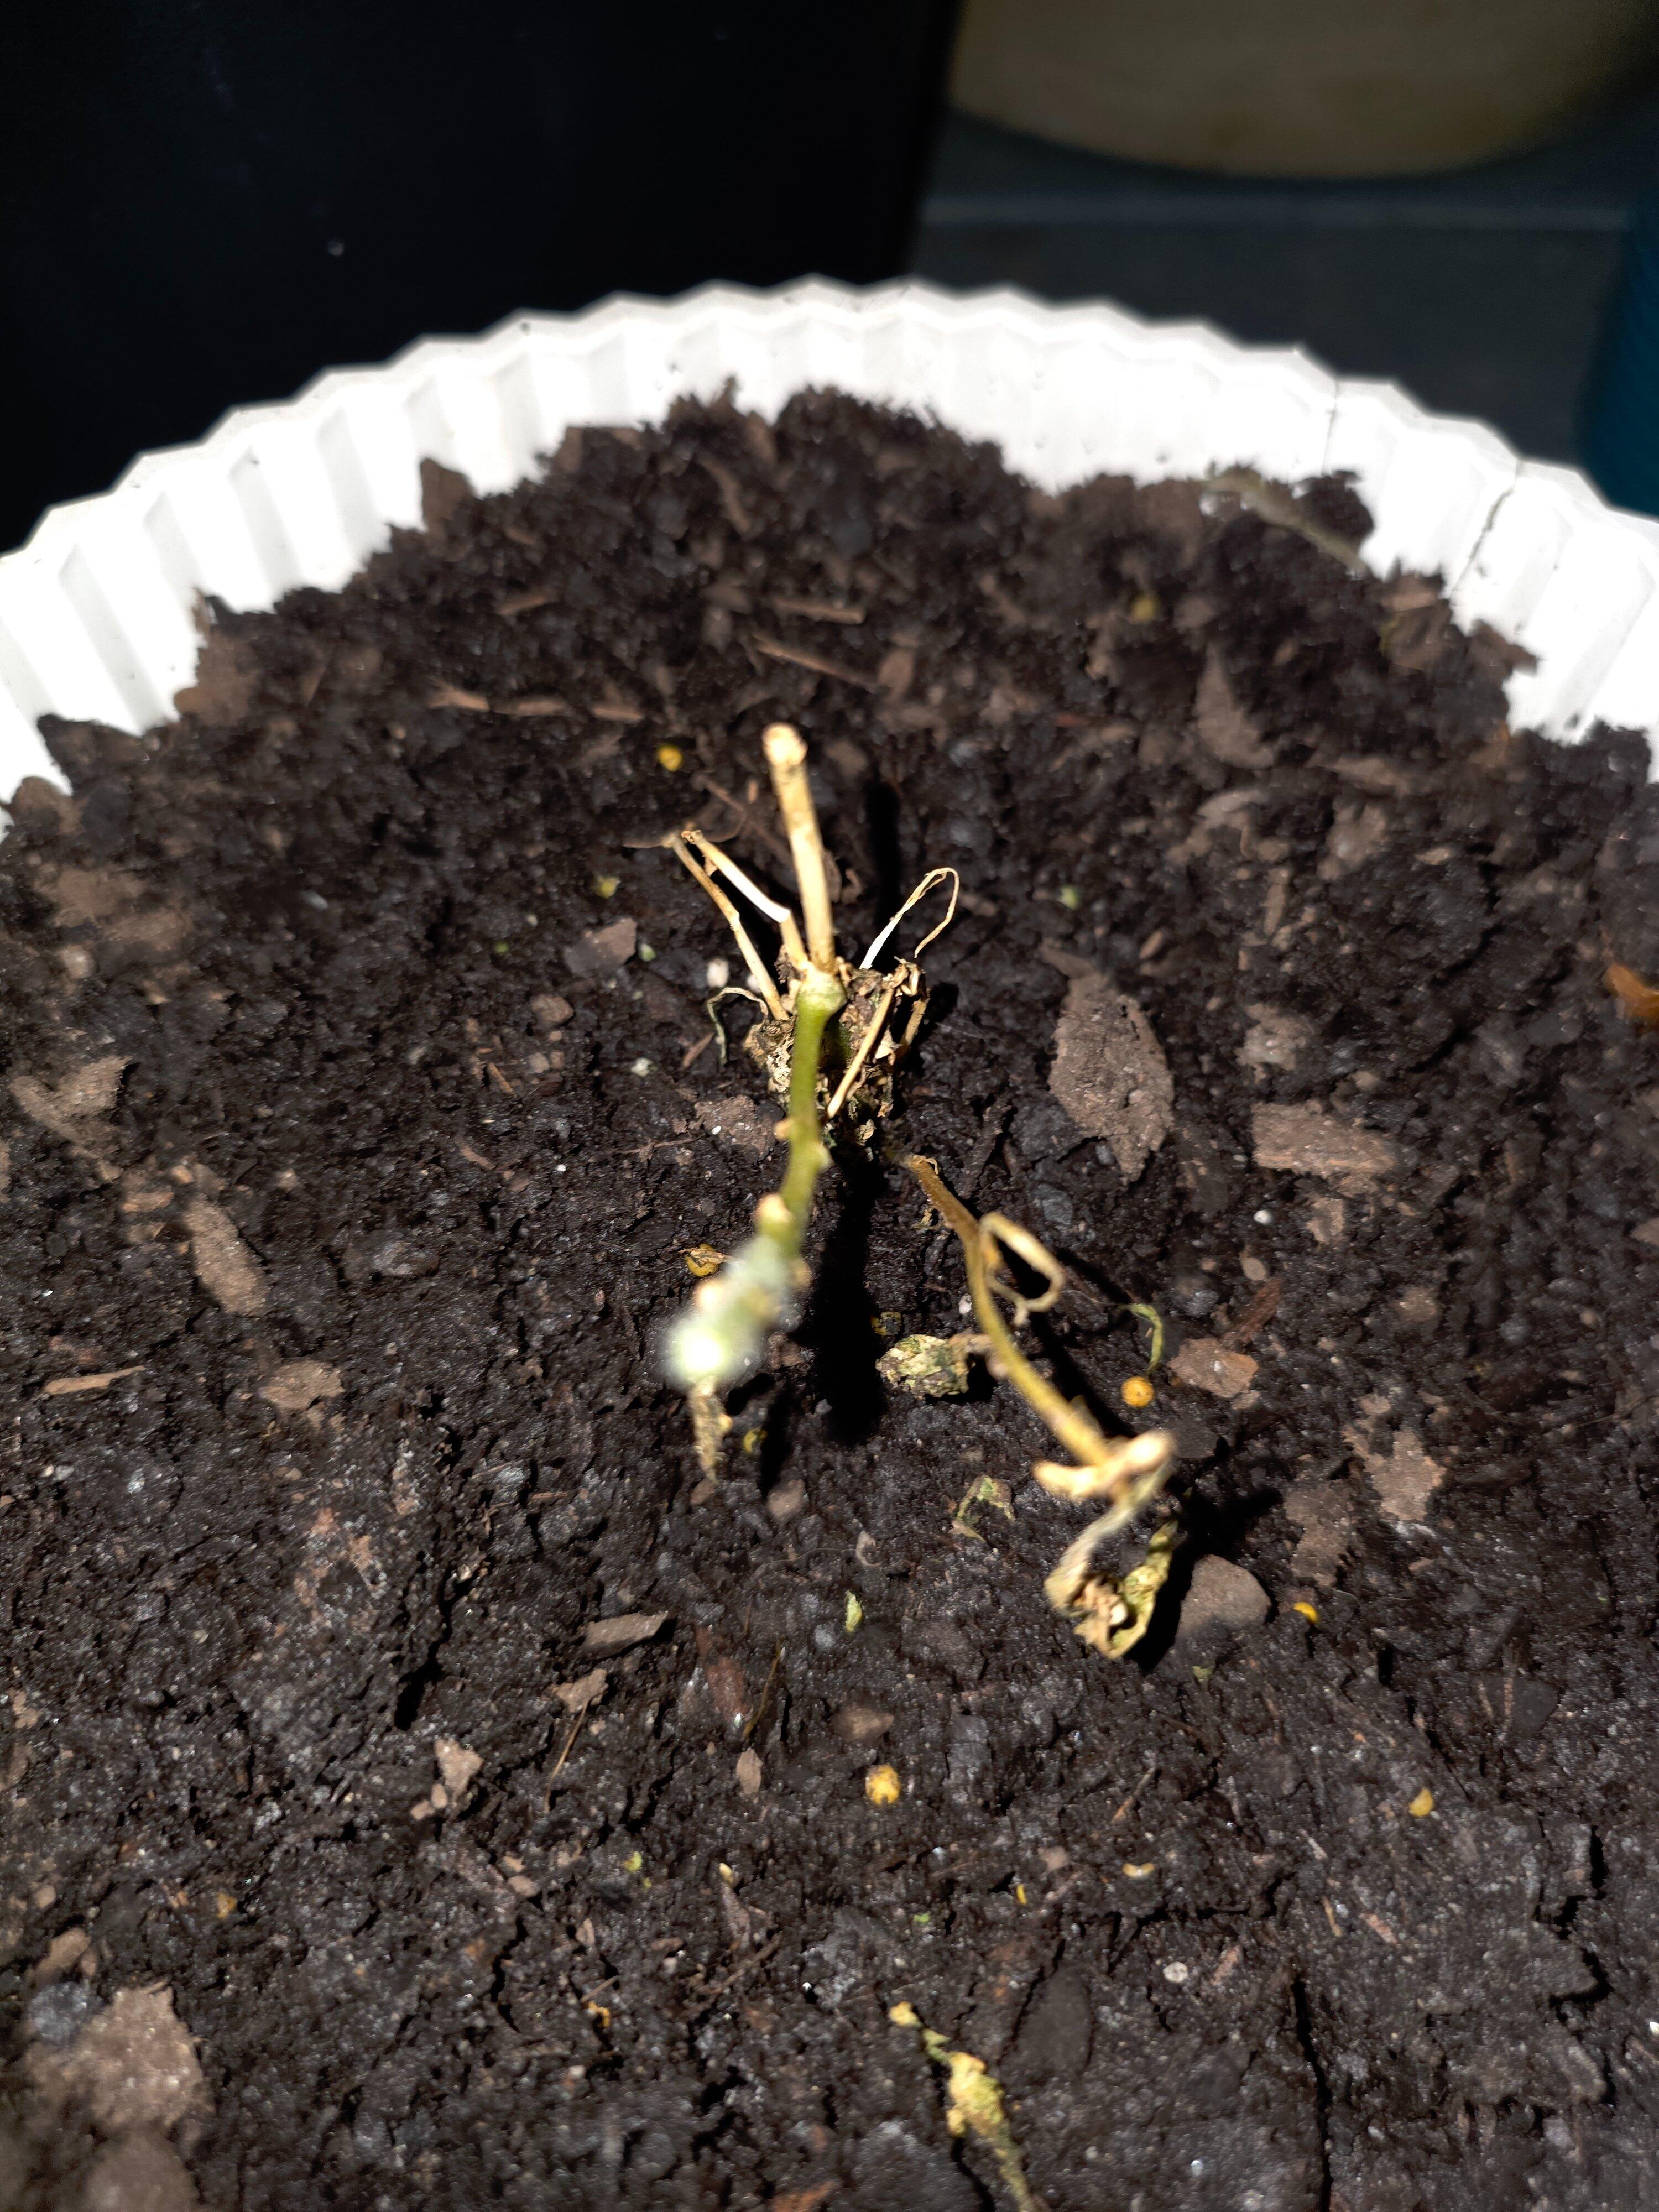
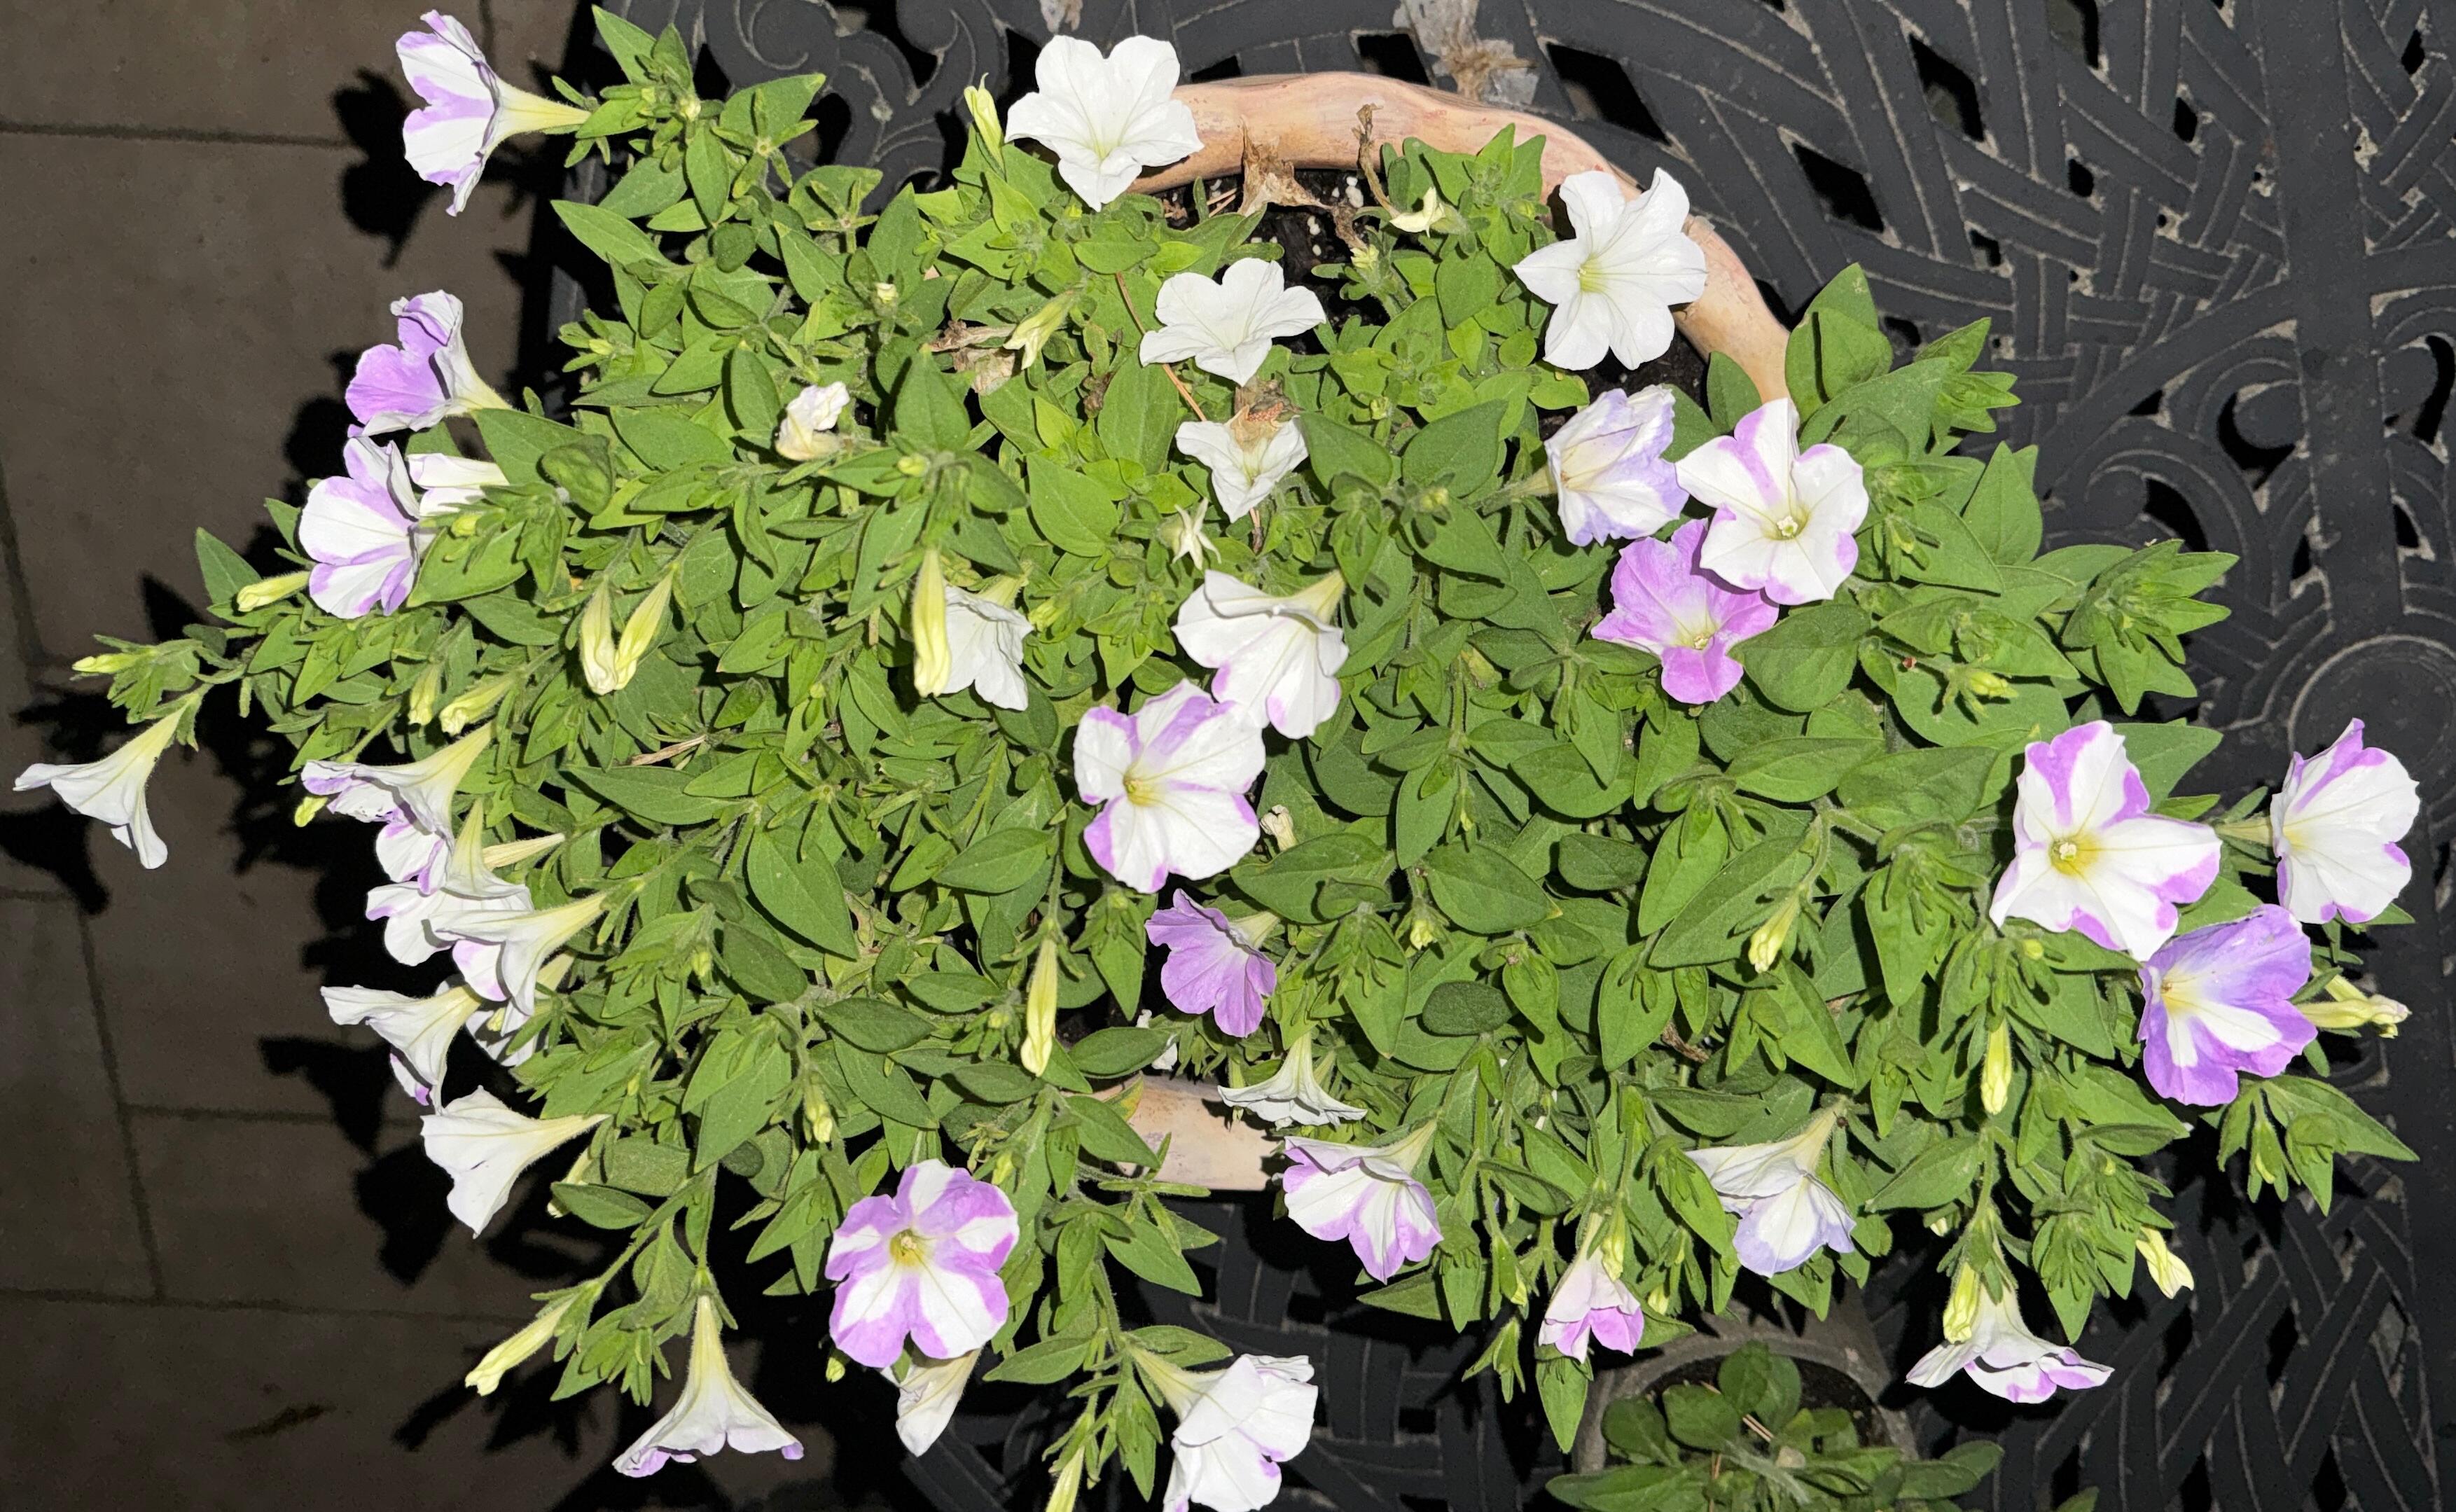
216 of the 830 published reviews include at least one photo, 393 photos in total, all images and no video in this export. The wall is a curated sample weighted toward five-star glow shots, with a few one and two-star photos kept in so arrival condition stays visible. Badge color marks the star rating. Photos load from the Judge.me image CDN. Not-published reviews also carry photos, which are not shown here.

Published rating distribution · for reference (share of 830)

5 ★
634
4 ★
61
3 ★
25
2 ★
32
1 ★
78
Within the published set alone, sentiment is strongly positive and 76% are five star. The one-star group at 78 is the second largest, and it is almost entirely about arrival condition. The contrast with the not-published mix above is the whole point of this chapter.

Average rating by month · published, substantive months (8+ reviews)

5.04.54.03.53.0 Season 1 · 2025 Season 3 · 2026 off season 4.89 Apr n=9 4.83 May n=140 4.79 Jun n=215 3.92 Jul n=12 5.00 Mar n=8 4.80 Apr n=80 3.51 May n=177 4.16 Jun n=183 May dip
Published quality is not flat. The Season 1 wave held near 4.8, then May 2026 drops to 3.51 across 177 published reviews before recovering to 4.16 in June. That dip lines up with the May shipping exception window, when a merge bug routed plant orders to slower ground service. The not-published bucket, which is far more negative, reinforces that arrival condition is the mechanism.

Reviews over time · published volume by month

2401200 Contract Season · Jan to Jun 2026 14021580177183 MarAprMayJunJulAugSepOctNovDecJanFebMarAprMayJun 20252026
Two seasonal peaks: a Season 1 wave in May and June 2025, then the Season 3 wave in April, May, and June 2026 inside the shaded contract window. Of the 830 published reviews, 449 land in the Jan to Jun 2026 Season. The not-published reviews follow the same seasonal shape.

Reviews by product family · published

Product familyReviewsAvg rating
Store / unattributed3034.68
Firefly Petunia (white)2224.27
Bundles & promotions1404.51
Firefly Petunia + Ceramic Pot (80FFPCP)613.48
Pink Petunia (45TPP)523.90
Pink & White Bicolor (45TPWP)474.30
Fertilizer 5-Pack53.40
Published reviews only. The white Firefly Petunia and the bundle packs carry the volume and rate well. The Ceramic Pot family at 3.48 and the Fertilizer 5-Pack at 3.40 sit lower, both small samples, and track the same arrival-condition theme.

Where reviews come from · collection source (published)

Review request email
508
All reviews page
132
Shop app
123
On-site web widget
56
Shopify customer account
8
Store review collection
3
The automated post-purchase review request email drives the large majority, 508 of 830. The not-published reviews came largely through this same flow, which is part of why they read as genuine verified-buyer feedback rather than spam.

Top locations · US cities by review count (published)

Chicago, IL
11
Los Angeles, CA
9
Denver, CO
9
Seattle, WA
9
Dallas, TX
8
Portland, OR
8
New York, NY
8
Sacramento, CA
7
Atlanta, GA
6
Tampa, FL
6
Minneapolis, MN
6
Miami, FL
6
US cities are well spread with no single dominant metro. Data-quality note: the largest single location string in the raw export is Mumbai with 84 reviews, almost certainly a geolocation artifact since Light Bio ships only within the United States. It is excluded from the ranking and flagged for the analytics log.

Operational signals

Photo reviewers are slightly happier. Among published reviews, those with a photo average 4.45 stars against 4.35 without, so the glow wall is representative of the published majority.
Almost no reviews get a reply. Only 5 of the 830 published reviews carry a public reply, all on one to three-star reviews. The 1,308 not-published reviews, where the real dissatisfaction sits, receive no response at all. Responding to unhappy buyers and revisiting the spam flags is the clearest action here.

Selected published verbatims · the storefront-visible voices

★★★★★
Love them. They're beautiful.
Anne S.glow
★★★★★
Really healthy little plants.
Guillermo A.plant health
★★★★★
Excellent customer service!
Hillary V.service
★★★★
Beautiful flowers with a fairytale look in the evening.
Richard S.glow
★★★★★
Super sad that they didn't light up at all but they are beautiful flowers, none the less.
Kimberly M.glow
★★★★★
3 of 6 plants did not survive. Flowers do not glow at all.
Karen J.arrival
These six are from the published set, reproduced as written. Names are first name plus last initial.

What customers talk about · published reviews mentioning each theme

Plant health on arrival
460
Glow / brightness
386
Packaging / shipping
371
Customer service
94
Value / price
60
Overlapping keyword matches on title and body, so one review can land in more than one theme. Even within the published set, arrival condition is the most-discussed topic.

Reading the themes

The glow delights. Published reviews mentioning the glow average 4.67 stars, the highest of any theme. When the product arrives healthy, it lands.
Arrival condition is the soft spot, and bigger than it looks. Published reviews mentioning arrival or plant condition average 4.02 stars, and the 1,308 not-published reviews are overwhelmingly about exactly this. It is the mechanism behind the May 2026 dip and the lower Ceramic Pot rating. It points at shipping transit and unboxing, not the plant concept.
Service and price rarely sting. Mentioned 94 and 60 times in published reviews, both small, and service mentions are mostly positive.

Method and notes

Source. A Judge.me review export for the Firefly Petunia store (zy9myt-r0), pulled June 29, 2026, in three files: all published, all not published, and all deleted. The export retained alongside this dashboard is summarized in src/data/judgeme_reviews_2026-06-29.summary.json.
All three buckets are counted. The three files hold 2,139 reviews: 830 published and curated ok, 1,308 not published, and 1 deleted. Headline metrics are reported two ways, the published-only average of 4.37 shown as 4.4, and the all-in average of 2.91 across every collected review. No duplicate rows were found across the published set, and only 10 near-duplicate bodies exist in the not-published set.
On the spam label. Judge.me marks 1,306 of the not-published reviews as spam. We did not take that at face value. Every not-published review has a reviewer email, 97% have a US location, all have body text, none contain links, none are heavy non-ascii, and 858 originate in the post-purchase request flow. On that evidence they are genuine reviews, predominantly negative, not spam. The reason for the flag is not determinable from the export and should be checked in Judge.me moderation settings, including any FTC review-rule implications of withholding genuine negative reviews.
Photos and video. 216 published reviews carry at least one photo, 393 photos in total, on the Judge.me image CDN. The export contains no video files. The gallery shows a curated subset chosen for variety across ratings.
Charts. Monthly average uses the rating column grouped by calendar month, charted for months with at least 8 published reviews to limit noise. Source, geography, product families, and theme counts read the Judge.me columns as exported. The Mumbai location cluster is treated as a geolocation artifact and excluded from the US city ranking.
Reviewer names are abbreviated to first name plus last initial, email-style names reduced to a short handle. Reviewer email and IP address are never displayed. This dashboard is internal and auth-gated, so the full picture is shown, including everything held back from the storefront.
14

End-of-season report

Answers to the review questions · Season Jan 1 to Jun 30, 2026 · Shopify export through Jun 22, GA4 and ads through Jun 28
Shopify total sales (Season)
$810,499
Net sales $798,379 plus tax. Across 11,782 orders and 17,092 units, gross $894,375 before $68,112 discounts and $27,884 returns.
Total ad spend
$195,631
$163,518 performance, $32,115 awareness. Meta $98,566, Google $94,821, Amazon $2,244.
Performance bonus earned
$0
Both bonus KPIs finished below their first tier. Detail in the table below and in chapters 10 and 11.

Your questions, and where each is answered

1Metric analysis, both channels. Shopify and Amazon KPIs are summarised below and detailed in 01 Revenue, 03 Channels, 04 Products, and 05 Geography.
2Performance review, what worked and what did not. The two-column read below, with channel-level proof in 11 D2C ROAS and 12 Total spend.
3Strategic insights for 2027. Seven recommendations at the foot of this chapter.
4What we did differently from last year. Side-by-side Season 1 versus Season 3 below.
5Did stock and shipping affect sales, including the offer periods. Dedicated panel below, drawn from 06 Discounts, 08 Shipping, 09 Speed & delays, and 13 Reviews.
6Bonus audit, Blended ROAS and Unique Engaged Visitors. The contract-tier table is next, on the same Jan 1 to Jun 30 window the agreement defines.
7Handoff inventory and what to leave running. Accounts, pixels, and the keep-alive list are at the end of this chapter.

Bonus audit · Season tiers on the contract basis (Jan 1 to Jun 30, 2026)

Bonus componentContract basisSeason resultFirst tierOutcomePayout
A. Blended D2C ROAS Platform-reported sales, sales campaigns 3.19x 4.00x Below tier 1 $0
A. same, GA4 de-duplicated Single-source attribution 1.89x 4.00x Below tier 1 $0
B. Unique engaged US visitors GA4 Active Users, US only 935,914 1,000,000 Below tier 1 $0
Total performance bonus $0
Both components finished short of their first tier, so the calculated bonus is $0 on either ROAS basis. ROAS reached 4.00x or better in February and March, then slid through the April to May scale-up as average order value softened, with Meta at 2.01x the main drag. Visitors came within roughly 64,000 of the 1,000,000 floor on the most generous Active-Users reading; the stricter engaged-visit definition (50% scroll, 10 seconds, or 2+ pageviews) sits lower again. The ROAS methodology in chapter 11 is written to be signed off before this is treated as final. June covers Jan 1 to Jun 28; Jun 29 and 30 are not yet in the data and do not change any tier.

Metric analysis · Shopify D2C

Gross sales$894,375
Discounts-$68,112
Returns-$27,884
Net sales$798,379
Total sales (incl. tax)$810,499
Orders11,782
Units17,092
AOV (gross / net)$75.91 / $67.76
Units per order1.45
The Online Store channel carried $783,865 of gross across 10,132 orders. The hero ceramic-pot line (80FFPCP) was the single largest product at $305,484, or 34% of revenue, with the three 45mm starter lines together adding another 49%. Fertilizer attached on 3,317 orders for $60,756. May was the largest month at $276,609 total sales; June fell to $83,525 as the live-plant shipping window closed.

Metric analysis · Amazon

LaunchMid-May 2026
Sponsored Products spend$1,624
SP attributed sales$6,661
SP ROAS4.10x
SP ad orders155
Brand-exact ROAS5.26x
1-plant auto ROAS5.02x
Total ad incl. SB Video$2,244 to $7,580
Amazon was a deliberately small, late pilot this Season. It went live only in mid-May once the new Season 3 listings and shipping pipeline were ready, so it ran for about six weeks rather than the full Season. On that short window the Sponsored Products side was efficient at 4.10x, led by brand-exact at 5.26x. Full Seller Central channel revenue lives in Amazon and can be appended to this report on request; the Marketplace Connect sync into Shopify recorded a further $21,262 across 456 orders.

What worked

  • Google was the engine. Brand search converted at a 9.84% click rate and PMAX on the ceramic pot was the largest single spend. Google blended to 4.03x, above the 4.0x line.
  • The product delivers on its promise. Reviews mention the glow 386 times at a 4.67 average. Product-market fit on the core claim is not in question.
  • Ceramic pot as hero. 80FFPCP was the right lead product at 34% of revenue and the highest AOV anchor.
  • Fertilizer attach. Petunia Nutrition added $60,756 across 3,317 orders, a clean margin and retention lever.
  • Amazon efficiency. Even on six weeks and a tiny budget, Sponsored Products returned 4.10x, with brand-exact at 5.26x. Room to scale next Season.
  • Awareness flight moved the number. The May 29 Facebook and YouTube push lifted June to 517,453 US users, the largest month of the Season.

What did not, and why

  • Meta dragged the blend. Performance Meta returned 2.01x against a 4.0x target and is the single reason blended ROAS missed tier 1. Heavy testing share and softer AOV during the scale-up.
  • Plant health on arrival. The most-mentioned review theme, 460 times at 4.02, and the ceramic-pot line scored just 3.48, the lowest of any product. This is a fulfilment and packaging issue, not a demand issue.
  • Replacement credits. $39,397 of the $68,112 in discounts, about 58%, was dead or delayed-plant replacement and courtesy credit, not marketing. True promo codes were only about $4,600.
  • Returns. $27,884 returned, concentrated where plants arrived in poor condition.
  • Awareness ceiling. Visitors landed near 936K, below the 1M floor. Tracking went live only on March 22, so January and February engaged-visit data is thin.
  • Late Amazon start. A mid-May launch left most of the Season on the table for the marketplace.

Did stock availability and shipping delays affect sales, including the offer periods

Short answer: shipping and plant-condition on arrival hurt more than stock did. Inventory was generally available all Season; the constraint that shaped revenue was the live-plant shipping calendar, not empty shelves.
The calendar capped the tail. Live plants ship Monday to Wednesday on a USDA hardiness schedule (shipping weeks 12 to 21) with a Tuesday cutoff, and the Season had a hard plant-shipping deadline of June 15. That is the direct reason June total sales fell to $83,525 after May at $276,609. Demand did not vanish; the safe-to-ship window closed.
Condition on arrival was the real cost. The brand absorbed all shipping (13,817 labels across 11,598 shipped orders, customer-paid shipping of $100 for the Season), and the soft spot was plants arriving dead or stressed. That shows up three ways that all agree: $39,397 in replacement and courtesy credit, a 4.02 average on the 460 reviews that mention plant health, and the ceramic-pot line at a 3.48 review average. A May routing incident, where merged orders dropped to Ground service, made a batch of that worse before it was corrected.
During the offer periods. Mother's Day (Apr 10 to May 10) drove the peak: May was the largest month and the Mother's Day ceramic variants alone did about $69,500. The trade-off is that ROAS dipped to 2.45x in May as volume and discounting rose and AOV softened to $72.30 from $80.63 in March. So the offers grew the top line but at thinner efficiency, and the same peak volume produced the heaviest replacement-credit load.
June sales $83.5K vs May $276.6KReplacement credit $39.4KPlant-health reviews 4.02 avgCeramic pot rating 3.48Free shipping fully absorbed

What we did differently this year · Season 1 (2025) versus Season 3 (2026)

DimensionSeason 1, 2025Season 3, 2026
Lead product45mm starter plantsCeramic-pot 80FFPCP as hero, starters as range
Channel focusAmazon-led, full Season on marketplaceShopify D2C-led, $810K total sales; Amazon a six-week pilot
Paid mediaMainly Amazon AdsGoogle PMAX plus brand search, Meta prospecting and retargeting, Amazon SP, plans built for seven more channels
AwarenessNone separatedDedicated Facebook and YouTube flights from May 29 for the visitor KPI
MeasurementPlatform reports onlyGA4 events, GTM, and this live Season dashboard, scroll and engagement tracking
Seasonal playNoneMother's Day campaign with dedicated creative and -MD SKUs, plus an end-of-season clearance
CatalogSingle listingsBundles and multipacks, delivery estimator, USDA shipping logic
Season 1 ran roughly $14,784 of Amazon spend to $61,929 of sales at 4.19x on the old ASIN. Season 3 was a much larger, Shopify-centred build with real measurement infrastructure and a multi-channel media engine. The cost of that breadth was that efficiency was spread thinner than a single tight Amazon program, and the new ceramic-pot SKU carried the fulfilment learning curve.

Strategic insights for 2027

1Fix fulfilment before scaling spend. The single highest-return project is plant condition on arrival. Cutting the $39K replacement load and lifting the ceramic-pot rating off 3.48 protects both margin and the review flywheel that ad efficiency depends on.
2Rebalance the media mix toward Google and Amazon. Both cleared 4.0x. Meta needs a tighter creative and audience discipline or a smaller share until it earns its way back. Start Amazon in week one, not mid-May.
3Stand up tracking before January 1. The visitor KPI was measurable only from March 22 this year. A clean GA4 and consent setup live on day one removes the early-Season blind spot and any audit ambiguity.
4Plan the calendar around the ship window. June fell off a cliff because the safe-ship window closed. Pull the awareness and offer push earlier so peak demand lands while plants can still ship, and pre-announce the cutoff to capture late buyers in May.
5Protect AOV during offers. Mother's Day grew volume but thinned ROAS to 2.45x. Lean on bundles and the fertilizer attach rather than blanket discounting to hold order value while still running a seasonal hook.
6Reset the bonus targets to the data. A 1,000,000-visitor floor and a 4.0x blended ROAS proved out of reach in this product and ship-window reality. If the incentive returns, tiers anchored to this Season's actuals will motivate without being unwinnable.
7Lean into what already works. The glow is loved (4.67), brand search converts (9.84% CTR), and fertilizer attaches cleanly. Build the 2027 story on those proven strengths.

Handoff · accounts, pixels, and assets under Light Bio control

GA4 property425544126
GTM container209449378
Google Ads3119356205
Meta ad account334289496322484
Shopify storezy9myt-r0
AmazonSeller Central, parent B0GTV5R53V
Email / SMSKlaviyo
All ad accounts, pixels, tracking, creative, landing pages, and automation flows are owned by Light Bio under the agreement. A full asset and credential inventory is being delivered as a separate handoff document inside the 5-business-day window.

Keep running · do not disconnect during cleanup

  • GA4 and GTM tags on light.bio. Removing them breaks Season-to-date and any 2027 baseline.
  • Shopify private app and API tokens behind the delivery estimator, Shopify Flow shipping logic, and bundle config.
  • Klaviyo flows and the ShipStation connection that fire delivery and post-purchase emails.
  • This dashboard worker and its data connector if you want the Season record to stay live after handoff.
Flag any account you intend to revoke before the end of the month and we will confirm what is safe to remove versus what an automated workflow still depends on, so nothing on the live storefront breaks.

Method and honest read

Every figure here is pulled from the same verified sources the rest of this dashboard uses: Shopify order-level financial exports for revenue and discounts, platform billing for ad spend, GA4 for visitors, Amazon Advertising for marketplace ad performance, ShipStation exports for fulfilment, and the Judge.me export for reviews. The Season window is Jan 1 to Jun 30, 2026 as the agreement defines it. The candid bottom line is that Season 3 built a real D2C business and the measurement to run it, the product is loved where it lands well, and the two things that held the Season back are fixable: Meta efficiency and plant condition on arrival. Neither bonus tier was reached, and that result is shown on the strict contract basis so it can be audited line by line.